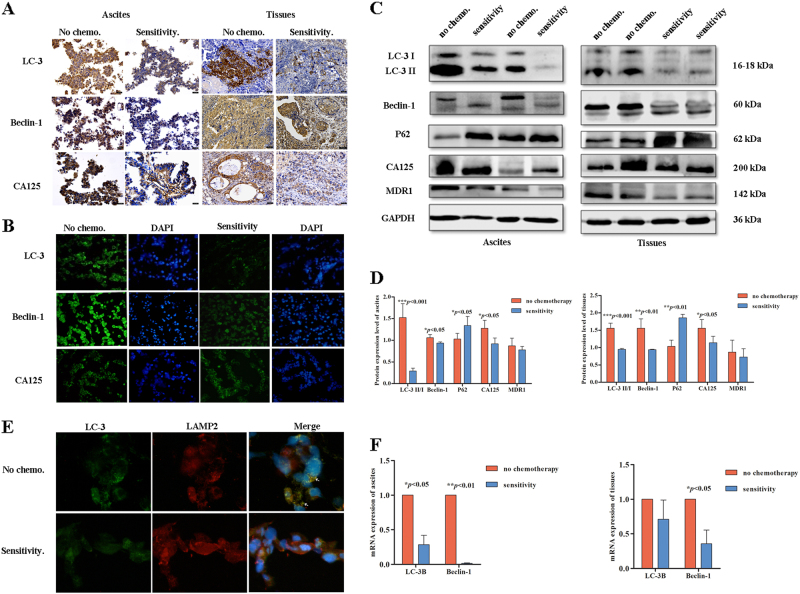
Fig. 4. Autophagy is reduced in the EOC chemosensitive group.
a, b IHC and IF analysis of autophagic protein expression in ovarian cancer samples. c,d Western blot analysis of autophagy proteins expressed in the no-chemotherapy group and chemosensitive group (***p < 0.001, **p < 0.01, *p < 0.05). e Immunofluorescence analysis of the no-chemotherapy group and chemosensitive group with LC3 (green) and LAMP2 (red) staining. Nuclei were counterstained with DAPI (blue). f qRT-PCR analysis of the average relative mRNA expression levels of autophagy-related genes in the no-chemotherapy group and chemosensitive group (**p < 0.01, *p < 0.05).

