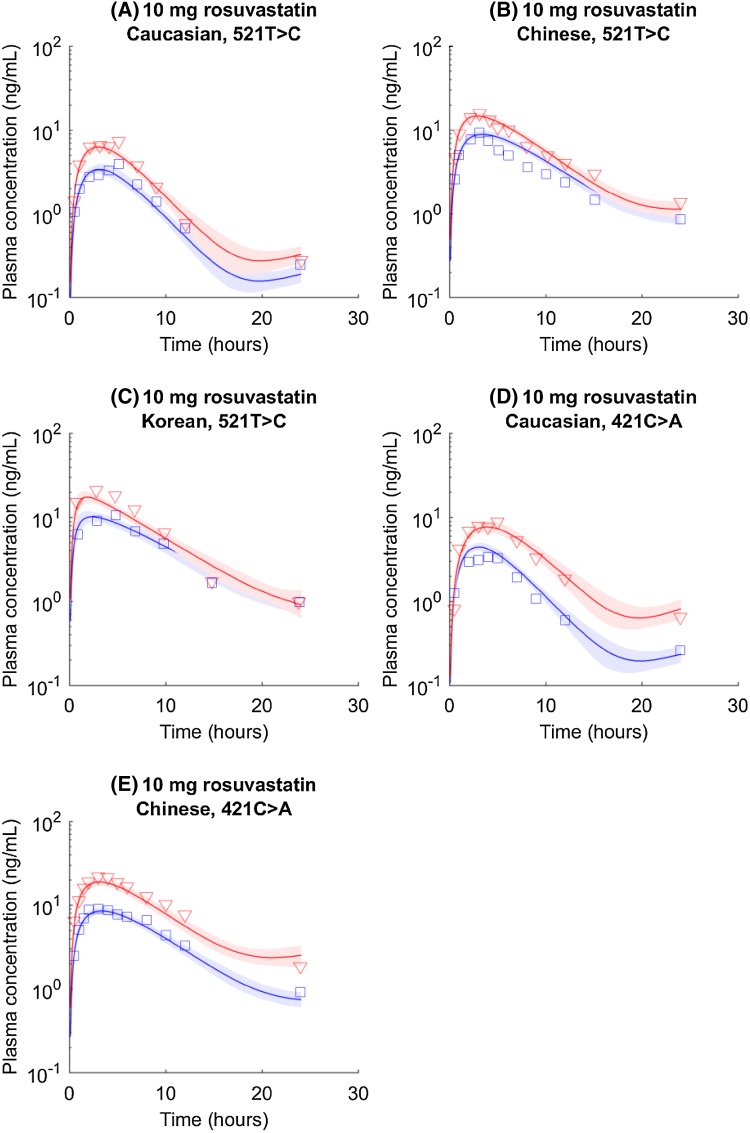
Fig. 1.
SLCO1B1 c.521T>C and ABCG2 c.421C>A genotyped rosuvastatin pharmacokinetic time courses in Caucasian, Chinese, and Korean populations. Blue circles and lines represent data and simulations for the wild type (i.e., SLCO1B1 c.521TT or ABCG2 c.421CC). Red triangles and lines represent data and simulations for homogenous mutations (i.e., SLCO1B1 c.521CC or ABCG2 c.421AA). Shaded areas indicate 95% confidence intervals approximated with parameter values generated in Markov chain Monte Carlo (confidence intervals presented here are to visualize the numerical uncertainty associated with mean simulations, but not inter-individual or inter-study variability. The same implication applies to the following figures)

