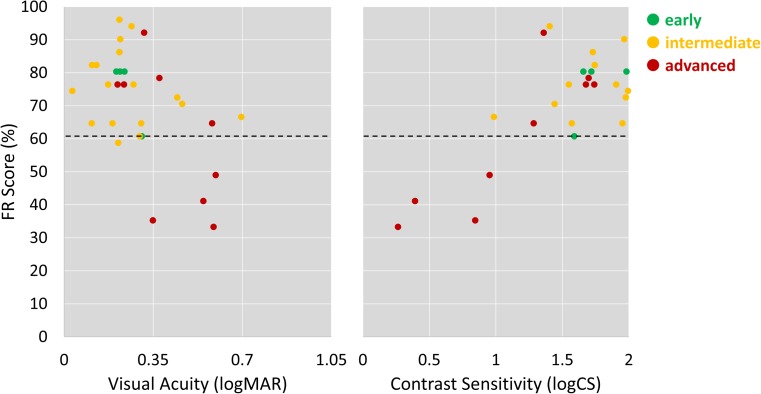
Fig. 4.
Scatter plots showing the relationship between FR score and contrast sensitivity and visual acuity amongst participants with dry AMD, colour-coded according to AMD classification. The dotted black line represents the 90% normative limit derived from the visually healthy controls. (Some horizontal jitter is added to the plotted points to allow visualisation of overlapping data points.)

