. 2018 Mar;30(1):53–57. doi: 10.5455/msm.2018.30.53-57
© 2018 Vedran Jakupovic, Suajb Solakovic, Nedim Celebic, Dzenan Kulovic
This is an Open Access article distributed under the terms of the Creative Commons Attribution Non-Commercial License (http://creativecommons.org/licenses/by-nc/4.0/) which permits unrestricted non-commercial use, distribution, and reproduction in any medium, provided the original work is properly cited.
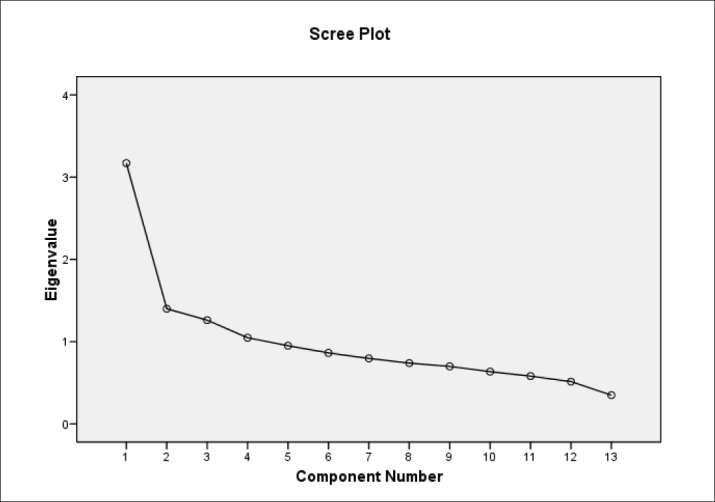
Figure 1. Scree-plot Motivation subscale–patients.

