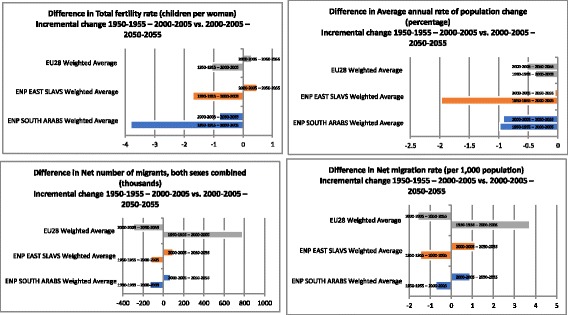
Fig. 1.

The most relevant differences in incremental change of population aging and migration indicators among the three regions (EU28/ENP East/ENP South) comparing the first half century horizon 1950–2000 with the latter one 2000–2050. Top left panel: Incremental change in total fertility rate (children per women); Top right panel: Incremental change in average annual rate of population change (percentage); Bottom left panel: Incremental change in net number of migrants, both sexes combined (thousands) and Bottom right panel: Incremental change in net migration rate (per 1000 population)
