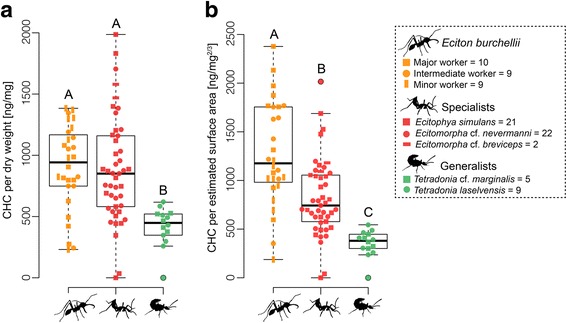
Fig. 5.

Army ant and parasite CHC concentrations. CHC amount per dry weight (a) and CHC amount as a function of estimated surface area (b) plotted for Eciton burchellii foreli workers, beetle specialists, and beetle generalists. Sample sizes are given in the figure legend. Different letters depict significant differences (p < 0.05) as assessed by a Dunn’s test
