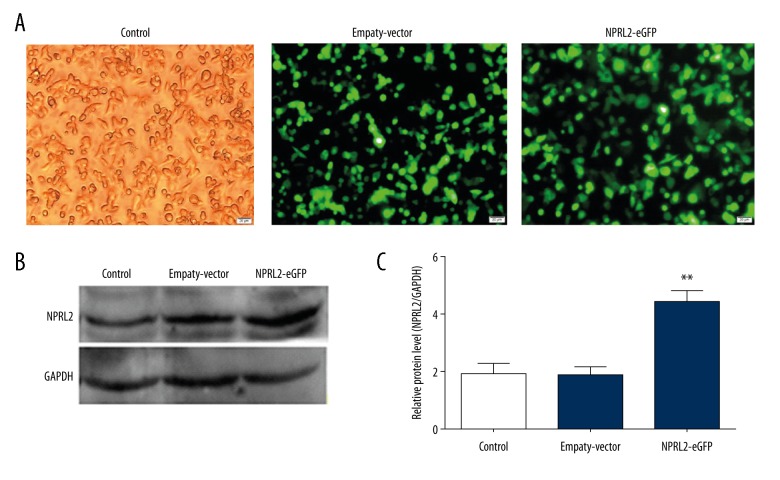
Figure 1.
Lentiviral transduction of NPRL2. Monitoring of the transduction efficiency of HCT116 cells by light and fluorescence microscopy (A). Western blot analysis was used to assess transfection efficiency (B, C). Results in bar graph are represented as mean ± SD from three different triplicate experiments. **P<0.01. (Control, cells without transfection; Empty vector (EV), cells transfected with empty vector; NPRL2-eGFP, cells transfected with NPRL2-overexpression vector).

