Figure 4.
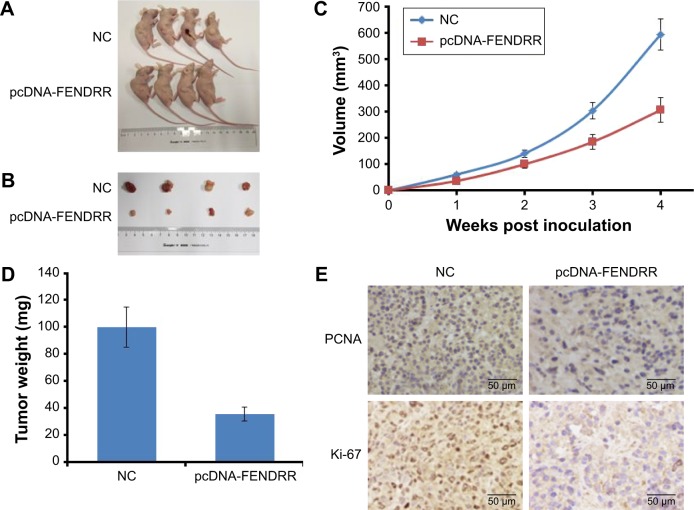
FENDRR inhibits tumor growth in a xenograft model.
Notes: (A, B) Representative image of xenograft tumors after being infected with MDA-MB-231 cells transfected with a control or pcDNA-FENDRR vector. (C) Tumor growth curve. Tumor growth was measured every week after injecting tumor cells. The error bars represent SD. (D) Tumor weight when the tumors were harvested. The data represent the mean ± standard deviation. (E) Representative immunohistochemical staining of proliferating cell nuclear antigen and Ki-67 in the MDA-MB-231 xenografts.
Abbreviations: NC, normal control; PCNA, proliferating cell nuclear antigen.

