
Figure 2.
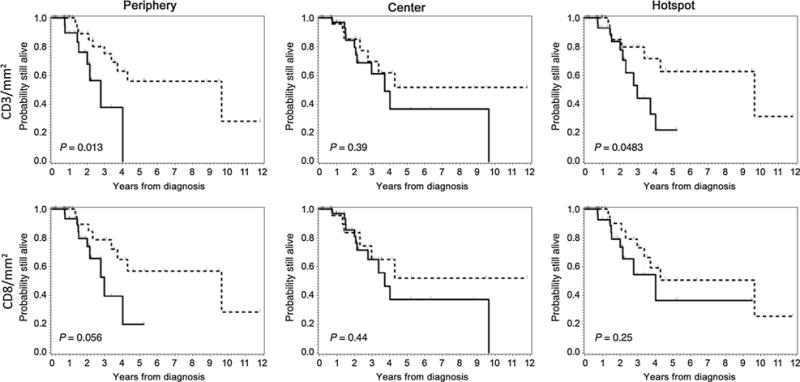
Kaplan-Meier analysis of overall survival among all MCC patients according to the density, composition, and distribution of the inflammatory infiltrate. OS according to immune cell density/mm2 at the periphery (left), center (middle), and hotspot (right) of MCCs. Top row, OS according to CD3+ T cells/mm2. Bottom row, OS according to CD8+ T cells/mm2. Legend: Patients with cell densities above the median indicated by dashed line (-----) and patients with cell density below the median indicated by solid line (———).