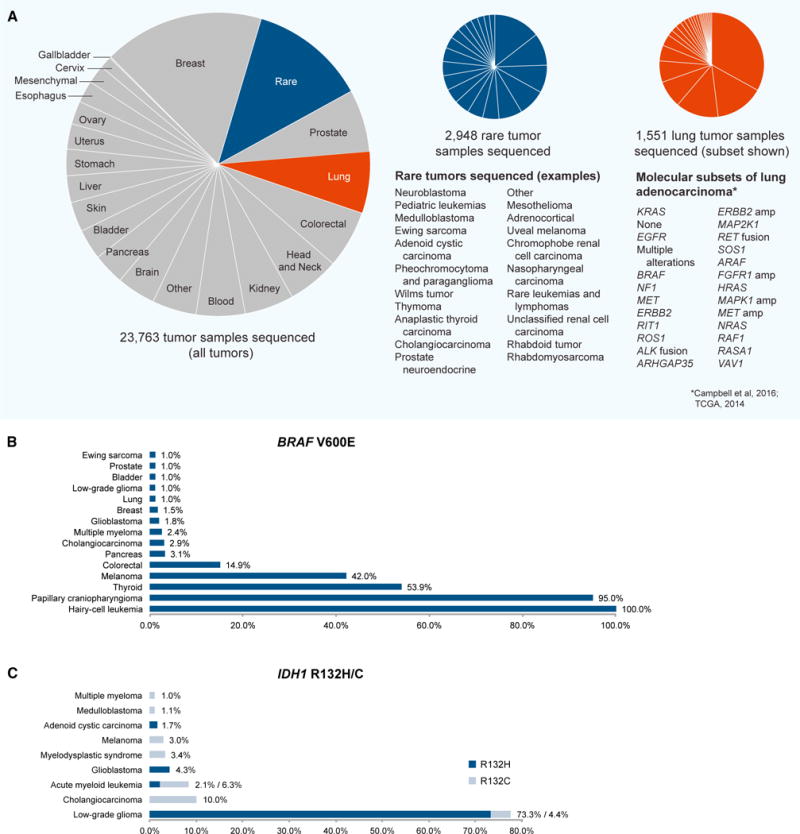
Figure 1. Progress toward the Genomic Characterization of Rare Cancers.

(A) Cancer types and subtypes that have been analyzed using whole-exome, whole-genome, or other next-generation sequencing to date. Left, all tumor samples by lineage (source data: www.cbioportal.org; https://gdc.cancer.gov/; Brastianos et al., 2014; Tiacci et al., 2011). Center, examples of rare tumor sequencing studies performed to date; “rare” is used in the figure to describe exceedingly rare cancers with an estimated incidence below ~1/100,000 in a population. Due to the evolving taxonomy of cancers, some subjective decisions were made with respect to classifying unusual subtypes of common cancers (incidence below ~1/100,000) as “rare” in this pie chart. Rare cancer types are listed in order of decreasing study size. Right, molecular subsets of lung adenocarcinoma. Molecular subtypes were identified using a cohort of 227 lung adenocarcinoma cases with complete data and expert histological review originally reported by Cancer Genome Atlas Research Network (2014) and re-analyzed by Campbell et al. (2016). The list of known and putative receptor tyrosine kinase/Ras/Raf pathway driver genes was derived by Campbell et al. (2016). Subtypes are listed in order of decreasing frequency.
(B) Frequency of BRAF V600E mutations across rare and common tumor types (source data: www.cbioportal.org).
(C) Frequency of IDH1 R132H/C mutations across rare and common tumor types (source data: www.cbioportal.org). cBioPortal and GDC datasets were accessed Feb–March 2017.
