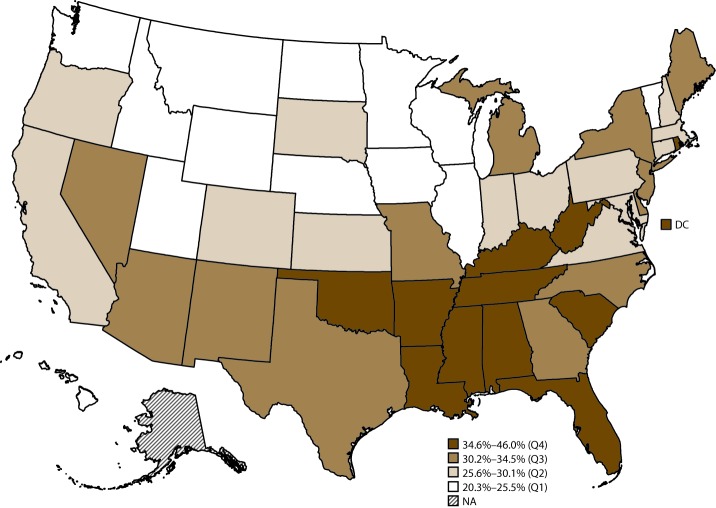
FIGURE 4.
Age-standardized prevalence of arthritis-attributable severe joint pain* among adults aged ≥18 years with arthritis, by state† — Behavioral Risk Factor Surveillance System, United States, 2015
Abbreviations: DC = District of Columbia; NA = not applicable; Q = quartile.
* Respondents with arthritis who answered 7, 8, 9, or 10 to the question “Please think about the past 30 days, keeping in mind all of your joint pain or aching and whether or not you have taken medication. During the past 30 days, how bad was your joint pain on average? Please answer on a scale of 0 to 10 where 0 is no pain or aching and 10 is pain or aching as bad as it can be.” Severe joint pain was defined as a pain level of 7–10.
† Estimate for one state (Alaska) with a relative standard error >30% or unweighted denominator <50 was suppressed as unreliable.

