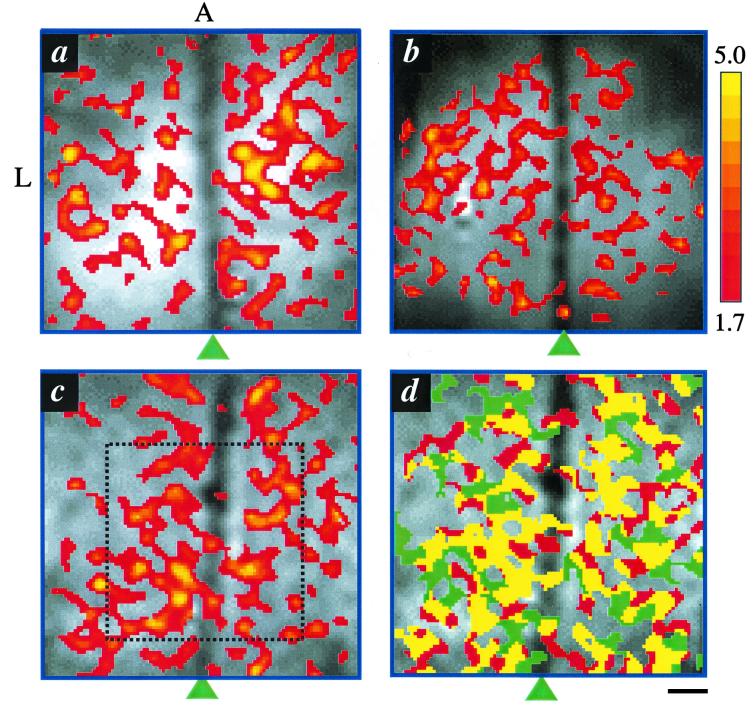
Figure 1.
(a–c) Representative single-condition, CBF functional maps of three cats overlaid on anatomical images. The colored bar shows the scale of the t values. Arrowheads indicate the positions of the midline. A 5 × 5-mm2 (64 × 64 pixels) region of interest shown in c was used for auto correlation analysis in Fig. 2. (d) Reproducibility of CBF functional maps. Ten repeated CBF fMRI measurements of a single-orientation stimulus were grouped into two sets: the first and the last five. The yellow color designates the pixels that belong to both sets. Pixels that are active only in one set are shown as red or green. A, anterior; L, left. (Scale bar = 1 mm.)

