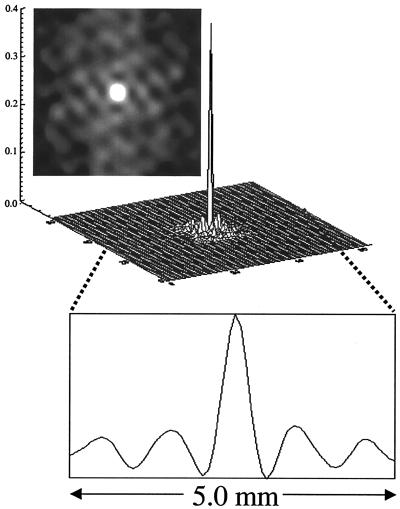
Figure 2.
Representative autocorrelation analysis of CBF t value map. A surface plot, a two-dimensional image of the autocorrelation map, and a horizontal profile across the autocorrelation map are shown. The periodic patterns in the autocorrelation suggest the presence of structured information. The columnar spacing (distance between the center peak and its neighboring peak) was estimated to be 1.0 mm, and the full width at half-maximum (of the center peak) of the columnar clusters was estimated to be 460 μm.

