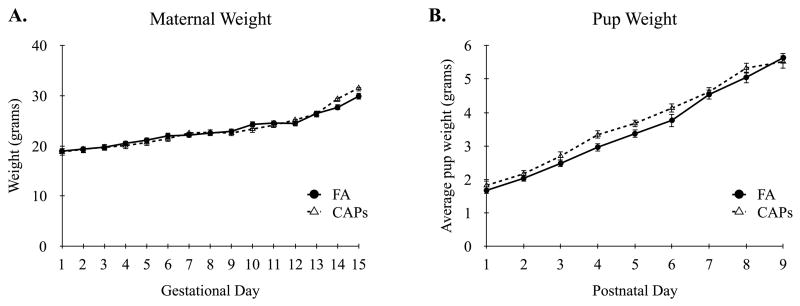
Figure 1.
Maternal Weight and Pup Growth Curves. (A) Pregnant dams of both FA and CAPs groups showed similar weight gains throughout gestation. (B) There were no differences in average pup growth (i.e. weight) during the first nine days of postnatal development. Linear mixed-effects modeling with treatment and time as fixed effects. Data shown as mean ± SEM. Sample size: FA n = 26 pups (13M/13F; 13 dams), CAPs n = 31 pups (15M/16F; 12 dams).

