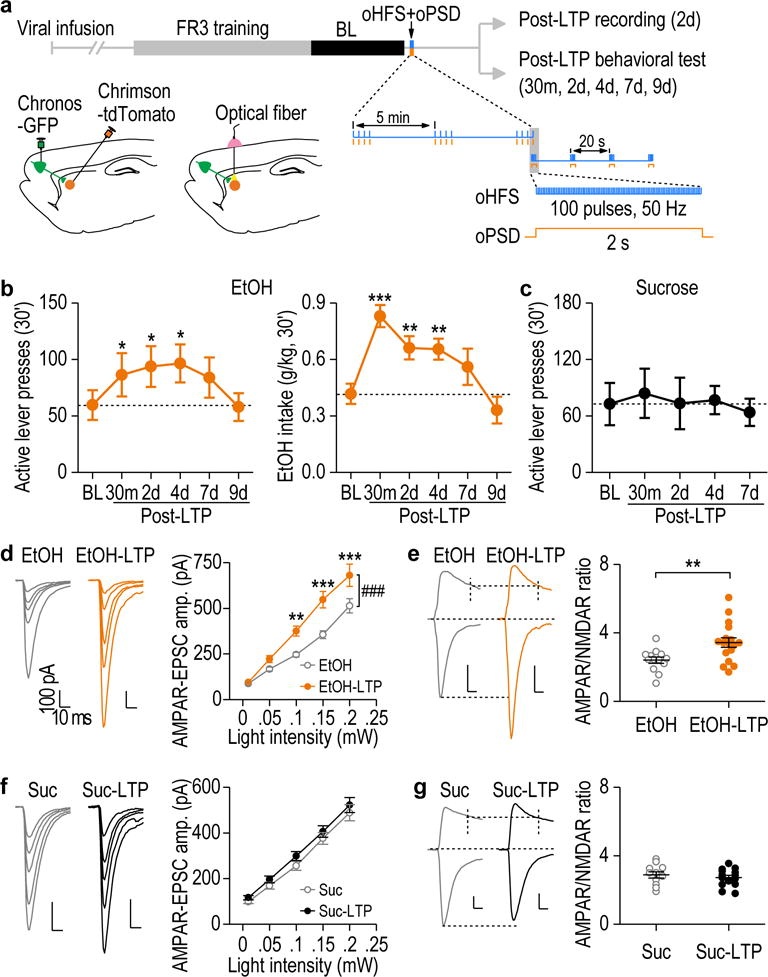
Figure 3.

In vivo optogenetic LTP induction in the DMS produced a long-lasting increase in operant alcohol self-administration. (a) Schematic of the training procedure and in vivo LTP induction protocol. (b) In vivo LTP induction produced long-lasting increases in active lever presses (left, F(5,54) = 3.26, P = 0.012) and alcohol (EtOH) intake (right, F(5,49) = 10.91, P < 0.0001). *P < 0.05, **P < 0.01, ***P < 0.001 vs. baseline (BL); n = 14 rats. (c) In vivo LTP induction did not alter active lever presses for sucrose. F(4,18) = 1.10, P = 0.39; n = 6 rats. (d) In vivo LTP induction caused potentiation of AMPAR-EPSCs on day 2 in alcohol-administered rats. Left and middle: Sample traces of AMPAR-EPSCs. Right: Input-output curves for AMPAR-EPSCs with (EtOH-LTP) and without (EtOH) in vivo LTP induction. F(1,107) = 15.62, P = 0.0005; n = 16 neurons, 5 rats (EtOH) and 13 neurons, 3 rats (EtOH-LTP). (e) Representative traces and averaged data showing a significant increase in the AMPAR/NMDAR ratio by LTP induction. t(28) = −2.88, P = 0.0075; n = 13 neurons, 5 rats (EtOH) and 17 neurons, 3 rats (EtOH-LTP). (f) In vivo LTP induction did not change AMPAR-EPSCs from the sucrose-administered rats. F(1,99) = 1.30, P = 0.27; n = 11 neurons, 4 rats (Suc) and 16 neurons, 5 rats (Suc-LTP). (g) AMPAR/NMDAR ratio did not change in the sucrose group after in vivo LTP induction. t(23) = 0.73, P = 0.47; n = 11 neurons, 5 rats (Suc) and 14 neurons, 5 rats (Suc-LTP). Scale bars: 10 ms, 100 pA for d-g. One-way RM ANOVA for b, c; two-way RM ANOVA for d, f; Two-sided unpaired t test for e, g. Data are presented as mean ± s.e.m.
