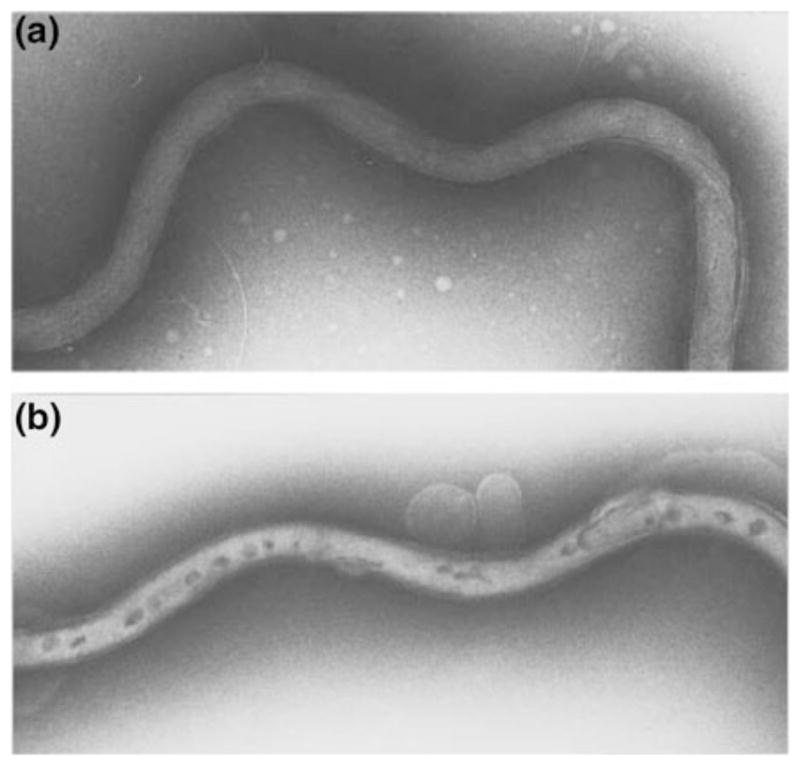
Fig. 1.

B. burgdorferi before (a) and after (b) electroporation as visualized by negative staining and transmission electron microscopy. Note the darkly stained regions that are thought to be transient pores generated by the electric pulse that serve as a passageway for DNA to enter the spirochete. Reprinted with permission from Samuels and Garon (1997)
