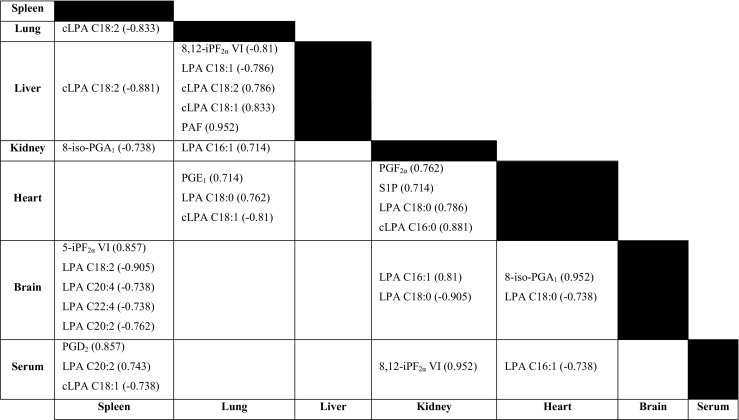
Fig. 7.

Spearman correlation analyses of paired tissue and serum samples. All correlations had p < 0.05, and the correlation coefficient is shown with its corresponding metabolite. cLPA cyclic lysophosphatidic acid, iP isoprostane, LPA lysophosphatidic acid, PAF platelet-activating factor, PG prostaglandin, S1P sphingosine 1-phosphate
