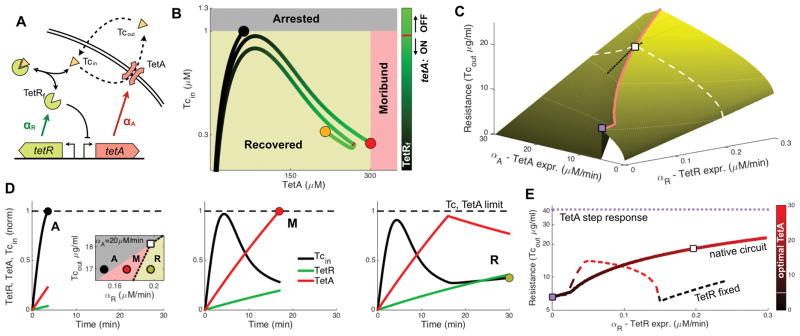
Figure 4. Mathematical model shows that fast expression of TetR is required for timely induction and repression of TetA.
(A) Mathematical model tracking intracellular drug concentration, taking into account diffusion of tetracycline across the membrane, dilution due to growth, export of tetracycline by TetA and binding of tetracycline and TetR. We model expression in the native circuit by both TetR and TetA being induced upon exposure, with TetA being repressed when the concentration of free (unbound) TetR crosses a given threshold (10nM). (B) Trajectories for different TetR expression rates in the space of TetA and free intracellular tetracycline concentrations, showing the upper limits on both TetA and tetracycline. (C) Maximum tetracycline concentration resisted by the native circuit for different values of TetR and TetA expressions. Each given TetR expression rate is optimized by a corresponding TetA expression rate (red line). The white square indicates the optimal TetA expression for a fixed TetR expression rate (white dashed line). The purple square shows the maximal resistance obtained with TetA induced in the absence of regulation by TetR. The black line shows the region depicted in the inset in (D). (D) Inset: cell fates for different values of Tcout and TetR expression. All three fates are possible within a small range of TetR expression. Time courses of intracellular concentrations of TetR, TetA and Tcin for the different points in the inset, showing the three cell fates observed experimentally. Tcin and TetA are normalized by their upper limits, and TetR is normalized by its optimized steady state concentration. (E) Resistance with optimized TetA expression as a function of TetR expression. The purple line indicates the ideal scenario of a step response (or constitutive expression) of TetA at its limit, while the purple square indicates the resistance obtained when TetA is induced upon exposure a the rate resulting in expression at the limit (maximal constitutive rate). The dashed line represents resistance when TetR is expressed constitutively instead of being induced. See also Figure S4.

