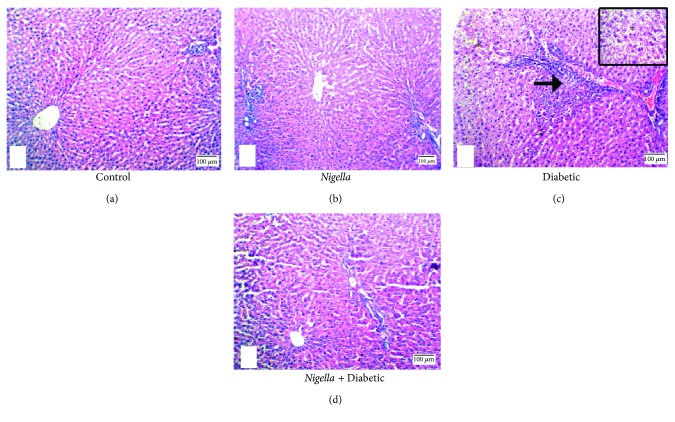
Figure 2.
H&E stain of liver: (a) control group and (b) Nigella-treated rats demonstrate normal hepatic architecture showing the classic lobule with the central vein at the center and portal tracts at the periphery; each one is separated from the others by a similar distance, 100x. (c) Diabetic group showing ballooning degeneration of the hepatocyte (∗, 40x), and interface hepatitis (arrow), 100x. (d) NSO-treated diabetic group showing restoration of normal architecture, 100x. Scale bar represents 100 μm.

