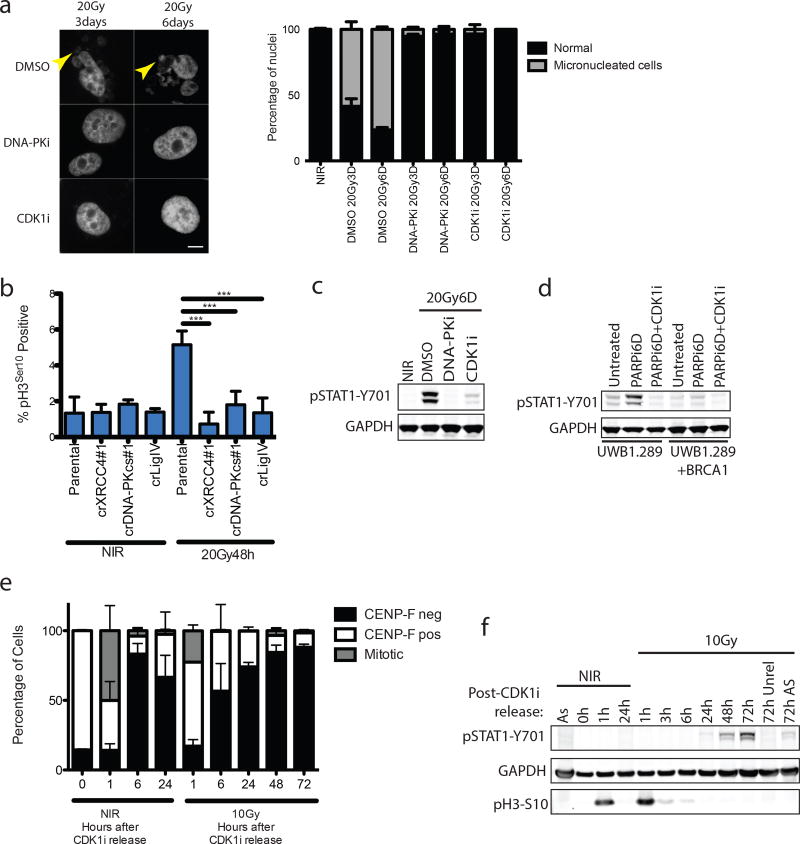
Figure 2. Progression through mitosis underlies inflammatory pathway activation.
a, Representative images of DAPI-stained MCF10A nuclei. Quantification was as described in methods and error bars represent SEM of 3 (DMSO and DNA-PKi) or 2 (CDK1i) independent experiments. Arrowhead highlights micronuclei. Scale bar is 10µm. b, The mitotic fraction of cells was quantified using H3 (Ser10) phosphorylation measured by flow cytometry and expressed as a percentage of total single cells. ***p<0.0001 with 1-way ANOVA and Dunnett’s multiple comparison for 3 independent biological replicates. c, Western blot of IR-induced STAT1 activation under the indicated conditions in MCF10A cells. d, Western blot of STAT1 activation in UWB1.289 or UWB1.289+BRCA1 reconstituted cells treated for 6 days with PARPi treatment with or without CDK1i. e, Cells were synchronized in G2 with CDK1i prior to irradiation and released for the indicated times. CENP-F positive (S/G2), CENP-F negative (G0/G1) and mitotic cells were quantified in 3 independent biological replicates. f, Representative western blot for STAT1 activation following the release scheme described in (e) (n=3 biological replicates). As, (asynchronous).

