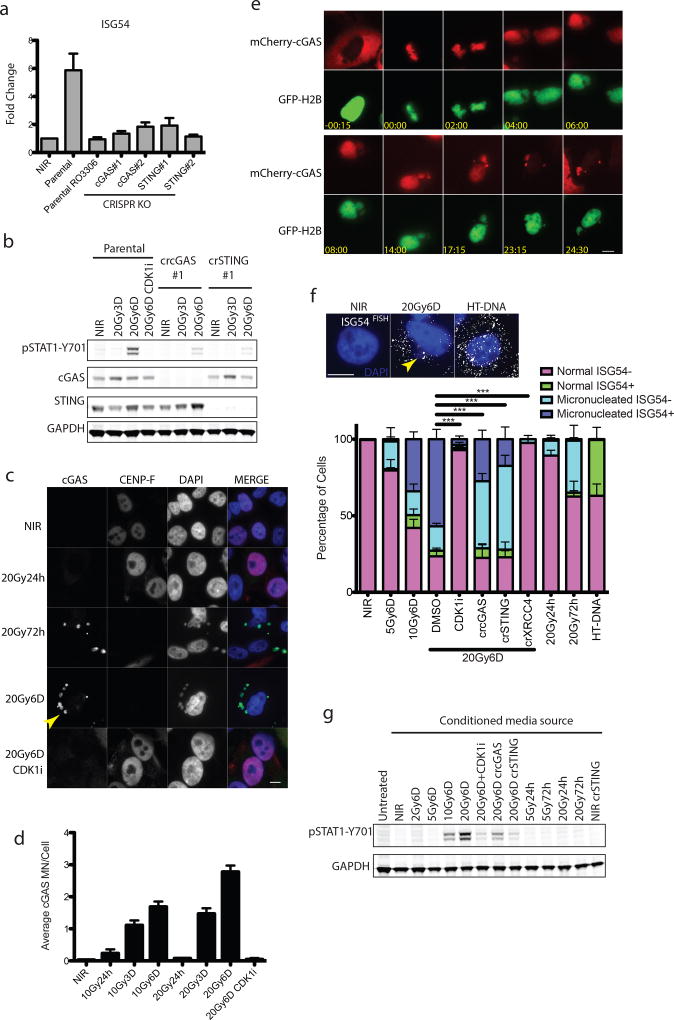
Figure 3. Relocalization of cGAS to micronuclei following mitotic progression triggers inflammatory signaling.
a, RT-qPCR of ISG54 at 6 days following 20Gy in parental MCF10A cells treated +/− CDK1i (RO-3306) or derivatives harboring deletion of cGAS or STING. Error bars represent SEM of three biological replicates. b, Representative western blots of STAT1 activation in CRISPR-CAS9 knockout MCF10A cells for cGAS or STING (n=3 biological replicates) c, Immunofluorescence of endogenous cGAS in MCF10A cells. Arrowhead indicates a representative cGAS-positive micronucleus. Scale bar is 10µm d, Quantification of micronuclei in (c). Error bars represent SEM of three biological replicates. e, Extracted frames from live cell microscopy of irradiated MCF10A cells stably expressing GFP-H2B to mark chromatin and mCherry-cGAS. Inset depicts time from obvious mitotic induction in hh:mm. f, Representative RNA FISH images (Scale bar is 10µm) and quantification of ISG54 status as described in Methods. Error bars represent SEM for 3 biological replicates. ***p<0.0001 by 1-way ANOVA and Bonferroni multiple comparison. Arrowhead indicates an example of a micronucleus. g, Representative western blot of STAT1 activation of naïve cells treated with indicated conditioned media for 24h (n=2 biological replicates).

