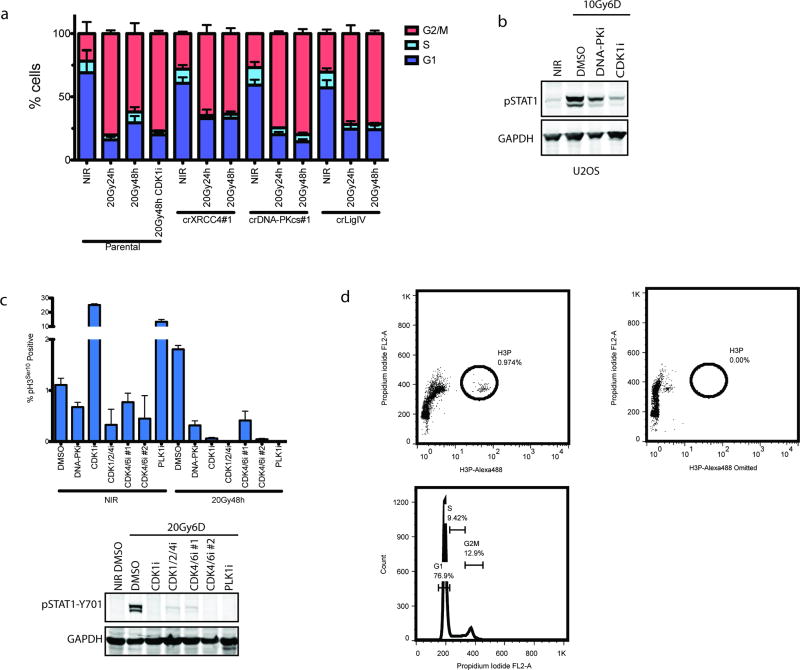
Extended Data Figure 2. Prevention of mitotic entry and cell cycle progression impairs IR-induced STAT1 activation.
a, Cell cycle profiles of MCF10A cells were monitored by flow cytometry of Propidium iodide-stained cells treated as indicated. b, U2OS cells were monitored for STAT1 activation in the presence of the indicated inhibitors. c, H3 (Ser10) phosphorylation in MCF10A cells was measured by flow cytometry and expressed as a percentage of total single cells. Error bars represent SEM of at least 2 biological replicates. Western blots show loss of STAT1 activation in treatments corresponding to the flow cytometry data. d, Example dot-plots of H3P flow cytometry showing the gating strategy using a sample with the conjugated H3-P antibody omitted. An example PI-staining gating strategy is also shown.

