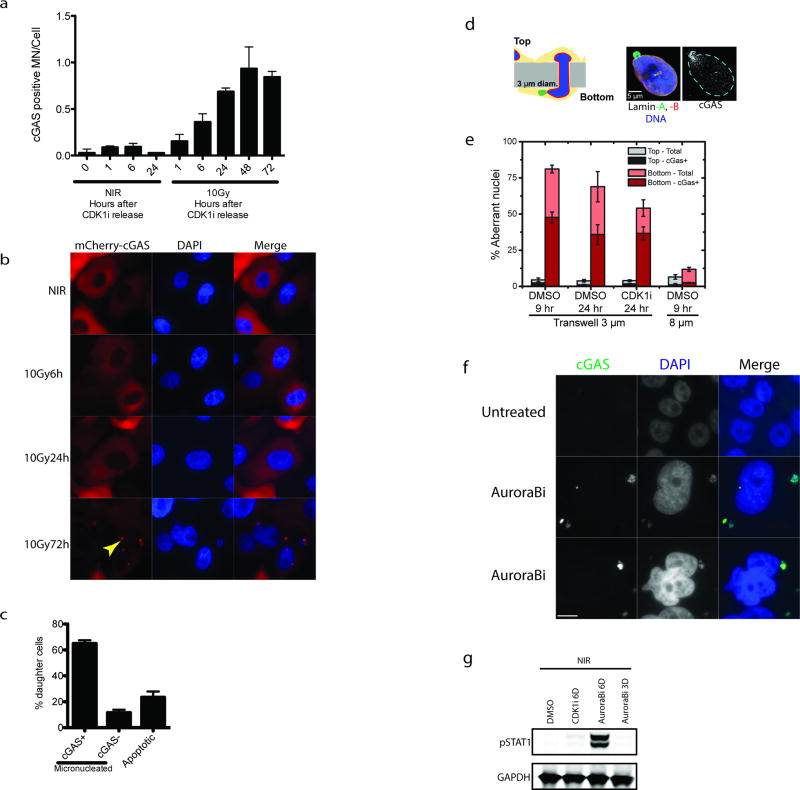
Extended Data Figure 4. cGAS dynamically relocalizes to micronuclei following mitosis, during migration and after Aurora B inhibition.
a, Cells in figure 2d were analyzed for the fraction of cGAS positive micronuclei following release from CDK1i. b, mCherry-cGAS expressing cells were monitored by IF following 10Gy. Arrowhead indicates mCherry-cGAS positive micronucleus. c, Histogram represents the fraction of daughter cells with cGAS positive micronuclei or that underwent apoptosis during live-cell imaging. All non-apoptotic daughter cells were micronucleated after division. Error bars are SEM of three biological replicates (n=99 total daughters). d, Schematic of nuclear migration transwell system. Blue is DAPI, Green is Lamin A and Red is Lamin B. cGAS is shown in grayscale. e, Quantification of aberrant nuclei (nuclear blebs and micronuclei) that are cGAS positive in the transwell migration assay. f, Immunofluorescent staining in an untreated and two representative cells after 6-day treatment with Aurora B kinase inhibition. Scale bar is 10um and similar patterns were observed in two independent experiments. g, Representative western blot of STAT1 activation in non-irradiated cells treated with Aurora B inhibitor for 3 or 6 days.

