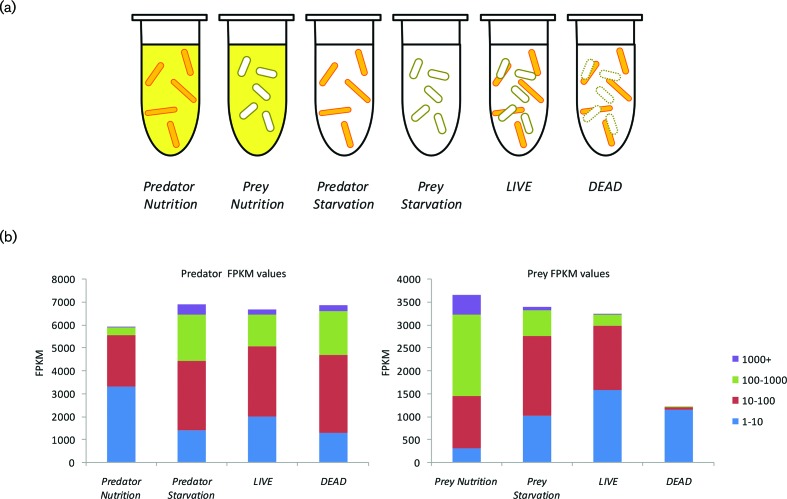
Fig. 1.
Gene expression under the six experimental conditions. (a) Experimental conditions for predator–prey RNAseq. M. xanthus predator (orange rods) and E. coli prey (white rods) were incubated separately or together, in either buffer (white background) or LBCY nutrient medium (yellow background). E. coli cells added to condition DEAD were heat-killed beforehand. (b) Gene expression (FPKM values) of the 7400 genes of the M. xanthus predator (left four columns) and the E. coli prey (right four columns), binned and coloured by magnitude, for each of the experimental conditions.

