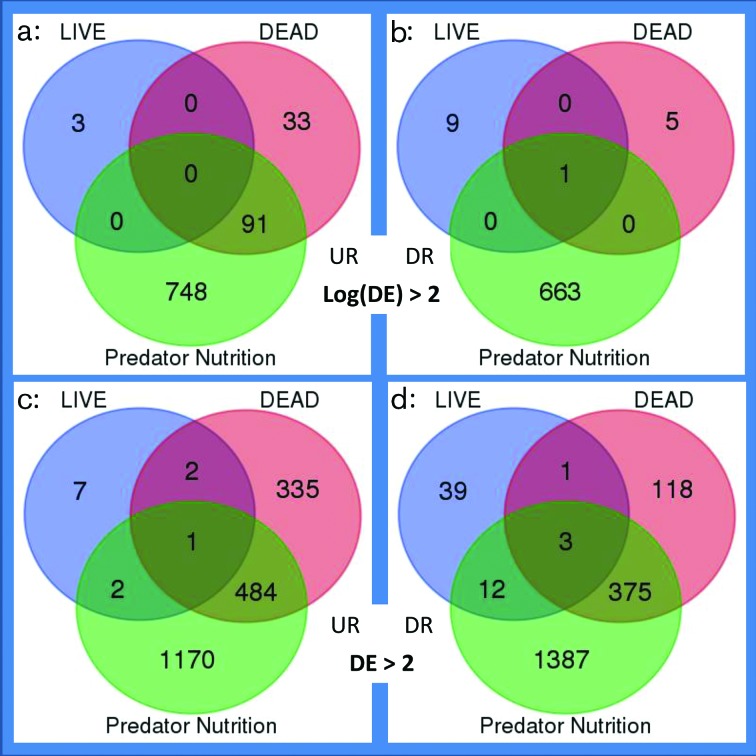
Fig. 2.
M. xanthus genes exhibiting differential expression (DE) on exposure to nutrients (Predator Nutrition), prey (LIVE) and pre-killed prey (DEAD), when compared with a nutrient-free control condition (Predator Starvation). DE gene numbers are shown for both high (a, b) and low (c, d) stringency filtering criteria [log(DE)>2 and DE>2, respectively]. Up-regulated genes (UR) are shown on the left (a, c) and down-regulated (DR) genes on the right (b, d).

