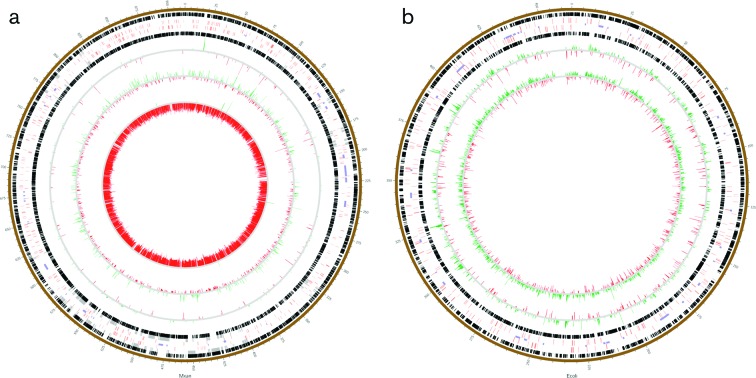
Fig. 3.
Circos diagrams of the M. xanthus (a) and E. coli (b) genomes. Numbers around the diagrams each designate 10 000 bp. Black boxes represent genes encoded on the two DNA strands, red boxes designate genes encoding signalling and/or DNA-binding proteins, purple boxes are genomic islands, and grey boxes denote genes of secondary metabolite biosynthesis clusters. Nested rings represent genes differentially expressed (up-regulated in green and down-regulated in red) when comparing transcriptome datasets. The three comparisons in (a) are LIVE versus Predator Starvation (outermost), DEAD versus Predator Starvation, and Predator Nutrition versus Predator Starvation (innermost). The two comparisons in (b) are LIVE versus Prey Starvation and Prey Nutrition versus Prey Starvation.

