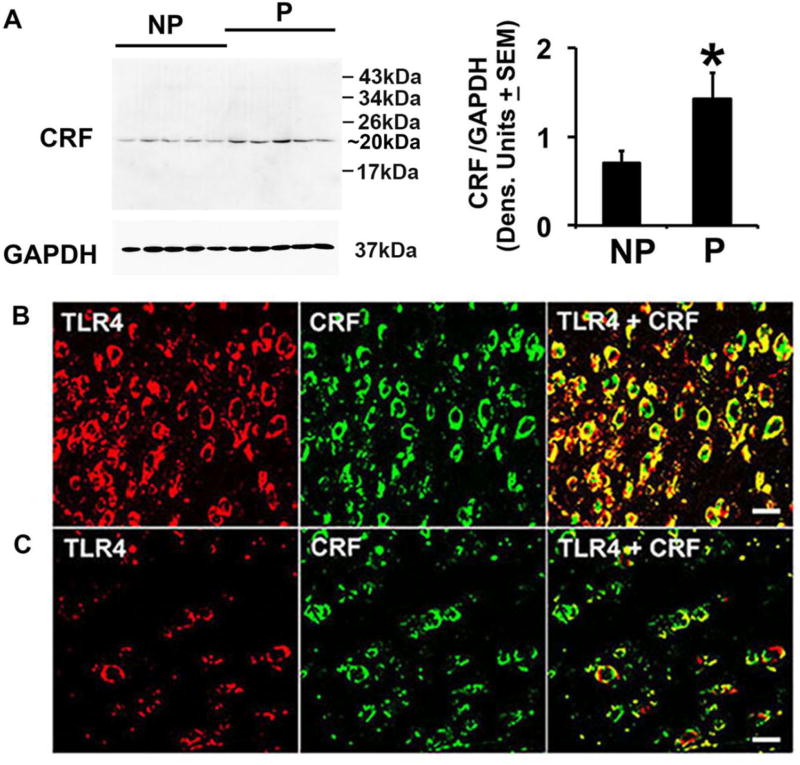
Fig. 2. The levels of CRF and numbers of TLR4+/CRF+ cells are elevated in the NAc-shell from P rats.
(A) Protein extracts of the micropunches examined in Fig. 1 were immunoblotted with CRF monoclonal antibody (Santa Cruz Biotechnology, Cat. # sc-293187), stripped and re-probed with antibody to GAPDH and the results are expressed as densitometric units normalized to GAPDH ± SEM. As also shown in SI, Fig. S2A, the only detected band is ~20 kDa and its levels are significantly (*p≤0.05 by ANOVA) elevated in P as compared to NP rats. Similar results were obtained for the polyclonal antibody (Bioss Antibodies, Cat. # bs-0246R). B, C) Confocal microscopy and Z-stack imaging of double immunofluorescent staining of NAc-shell sections (n=5/group) with TLR4 (red) and CRF (Bioss Antibodies, Cat. # bs-0246R) (green) antibodies. Merged images reveal numerous CRF+ neurons expressing TLR4 in the NAc-shell from P rats (B), but the numbers of TLR4+/CRF+ cells are significantly lower in the NAc-shell from NP rats (C). Scale bars: 20 µm. The % co-staining cells are summarized in Table 1.

