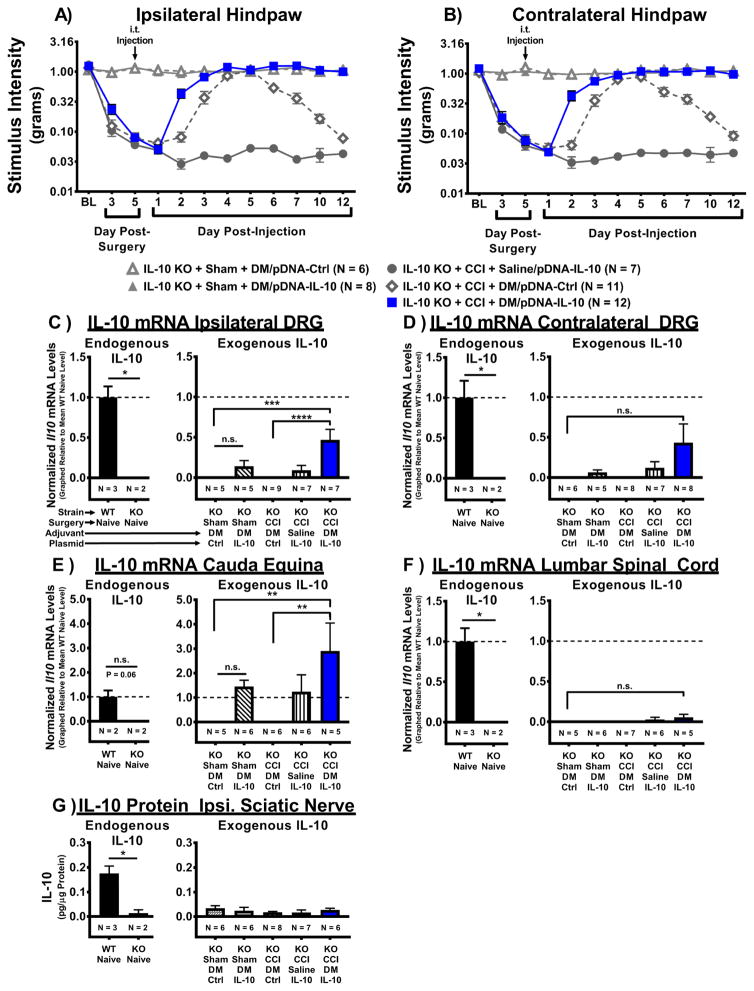
Figure 2. I.t. non-viral IL-10 gene therapy in IL-10 KO mice leads to expression of IL-10 transgene in pain-relevant lumbar dorsal root ganglia.
Absolute threshold behavioral responses for (A) ipsilateral and (B) contralateral hindpaws are shown. At baseline (BL), responses to low threshold mechanical stimuli were similar between all groups (ipsilateral, F(4, 39) = 1.39, P > 0.05; contralateral, F(4, 39) = 1.04, P > 0.05). For data collected between BL through Day 5 post-surgery a main effect of time (ipsilateral, F(1.7, 66.1) = 184.69, P < 0.001; contralateral, F(2, 78) = 186.41, P < 0.001) is observed. After behavioral assessment on Day 5 post-surgery, Sham- or CCI-treated mice received an i.t. co-injection of DM (25μg in 3μL) with either pDNA-IL-10 (3μg in 7.5μL) or pDNA-Ctrl (N = 6–12 mice/group). An additional control group consisted of CCI-treated mice that received i.t. saline with pDNA-IL-10 (N = 7). Following injection, a main effect of time (ipsilateral, F(6.0, 233.1) = 49.09, P < 0.001; contralateral, F(8, 312) = 46.2, P < 0.001) and an interaction of time and treatment (ipsilateral, F(23.9, 233.1) = 29.11, P < 0.001; contralateral, F(32, 312) = 25.13, P < 0.001) were observed. Comparisons between groups reveal that on Day 2 post-injection, CCI+DM/pDNA-IL-10-treated mice exhibit bilateral reversal from allodynia compared to mice lacking DM treatment (CCI+Saline/pDNA-IL-10) (ipsilateral and contralateral, P < 0.001). Surprisingly, on Day 3 post-injection, mice given DM and the control plasmid (CCI+DM/pDNA-Ctrl) reach levels of hindpaw sensitivity similar to Sham+DM/pDNA-IL-10-treated controls (ipsilateral and contralateral, P > 0.05). Beginning on Day 6 post-injection, CCI+DM/pDNA-Ctrl mice begin to return to bilateral allodynia (ipsilateral, F(3, 117) = 19.67, P < 0.001; contralateral, F(3, 117) = 9.73, P < 0.001), while mice treated with DM/pDNA-IL-10 never return to allodynia. (C–E) mRNA isolated from DRG and cauda equina tissues collected on Day 12 post-injection (Day 17 post-surgery) reveal IL-10 expression. IL-10 (Il10) mRNA levels were observed in WT Naïve positive controls (N = 3) but not in IL-10 KO Naïves (N = 2) for (C) ipsilateral, (D) contralateral lumbar DRG, and (F) lumbar spinal cord tissues (*P < 0.05), but not (E) cauda equina, despite a strong trend for positive expression (P = 0.062). IL-10 mRNA expression was not significantly different between Sham-treated conditions for DRG, cauda equina, and lumbar spinal cord (P > 0.05). (C) IL-10 transgene mRNA expression was significantly elevated in ipsilateral DRG of pain-relieved CCI+DM/pDNA-IL-10-treated IL-10 KO mice compared to IL-10 KO mice given either CCI+DM/pDNA-Ctrl or Sham+DM/pDNA-Ctrl (F(4, 28) = 7.72, P < 0.001). (D) No significant increase in IL-10 transgene mRNA levels were detected in contralateral DRG following i.t. injection (F(4, 29) = 2.20, P = 0.093). However, a priori comparison revealed that contralateral DRG from CCI-treated mice given DM co-treated with the IL-10 transgene contained significantly greater IL-10 mRNA levels than DRG from CCI-treated mice given DM with the control plasmid (P < 0.05) or Sham-treated mice with DM and the control plasmid (P < 0.05). (E) In the cauda equina, IL-10 transgene mRNA expression was greatly elevated in pain-relieved CCI+DM/pDNA-IL-10 KO mice compared to negative control conditions CCI+DM/pDNA-Ctrl and Sham/DM+pDNA-Ctrl (F(4, 23) = 4.19, P = 0.011). (G) IL-10 protein was detected in ipsilateral sciatic nerve (collected Day 12 post-injection) of WT Naïve but not IL-10 KO Naïve mice (P < 0.05), but no significant increase in IL-10 expression was detected in any i.t. injection condition (F(4, 27) = 0.65, P > 0.05). For mRNA and protein analyses, N = 5–7 mice/group. mRNA levels (mean ± SEM) are normalized to 18S rRNA and graphically presented relative to mean WT Naïve levels. For protein analyses, protein levels are presented as mean ± SEM. Post-hoc multiple comparisons via Fisher’s LSD (α = 0.05; *P < 0.05; **P < 0.01; ***P < 0.001).

