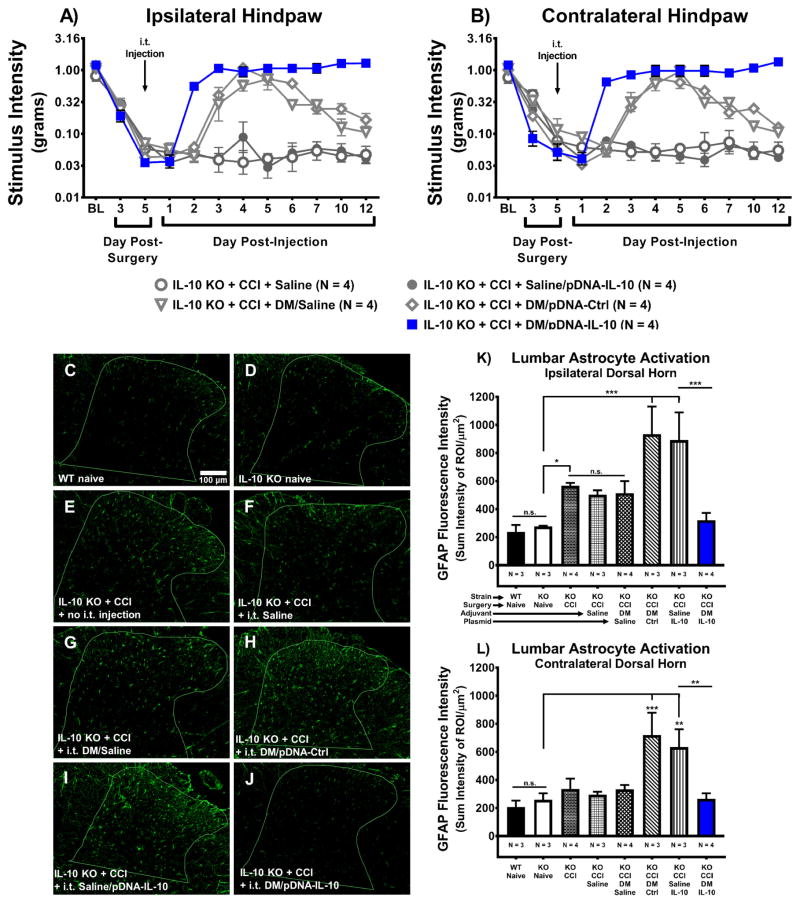
Figure 6. Intrathecal non-viral IL-10 gene therapy decreases astrocyte activation in the lumbar spinal cord dorsal horn.
Absolute threshold behavioral responses for (A) ipsilateral and (B) contralateral hindpaws are shown. Again replicating our prior results illustrated in Figs. 1 and 2, BL responses to low threshold mechanical stimuli were similar between all groups (ipsilateral, F(4, 15) = 1.25, P > 0.05; contralateral, F(4, 15) = 48.84, P < 0.001). For data collected between BL through Day 5, a main effect of time (ipsilateral, F(2, 30) = 306.14, P < 0.001; contralateral, F(2, 30) = 221.66, P < 0.001) was observed, again replicating our prior data (Figs. 1 and 2). After behavioral assessment on Day 5 post-surgery, all mice received an i.t. co-injection of pDNA-IL-10 (3μg in 7.5μL) with DM (25μg in 3μL) vs. DM/pDNA-Control, pDNA-IL-10 with saline, DM with saline, or saline alone. Following injection, a main effect of time (ipsilateral, F(8, 120) = 35.817, P < 0.001; contralateral, F(8, 120) = 42.82, P < 0.001) and an interaction of time and treatment (ipsilateral, F(32, 120) = 9.81, P < 0.001; contralateral, F(32, 120) = 13.53, P < 0.001) were revealed. Comparisons between groups show that on Day 2 post-injection, CCI+DM/pDNA-IL-10-treated mice exhibit bilateral reversal from allodynia (ipsilateral, P < 0.001; contralateral, P < 0.001) compared to CCI+Saline/pDNA-IL-10-treated control mice, and these mice never return to allodynia. Surprisingly, on Day 3 post-injection, DM/Saline and DM/pDNA-Ctrl treated mice reverse from allodynia (ipsilateral, P < 0.001; contralateral, P < 0.001) but on Day 6 post-injection both control groups begin to return to bilateral allodynia (ipsilateral, F(3, 45) = 6.27, P < 0.01; contralateral, F(3, 45) = 5.62, P < 0.01). These transient effects of DM on pain thresholds was previously observed in data from separate experiments represented in Fig. 2. N = 4 mice/group for all behavioral conditions. (C–J) Representative images (20x objective) of GFAP-stained lumbar spinal cord dorsal horn sections from tissues collected on Day 12 post-injection that were part of the image analysis. (K–L) Image analysis of acquired GFAP-stained images of ipsilateral and contralateral lumbar spinal cord dorsal horn revealed a main effect of gene therapy treatment (F(7, 19) = 6.71, P < 0.001; F(7, 19) = 5.64, P < 0.01, respectively). Acquired GFAP-stained images of contralateral lumbar spinal cord dorsal horn are not shown, as the images appear highly similar to those from the ipsilateral lumbar spinal cord. Statistical analyses reveal no significant ipsilateral or contralateral differences in GFAP fluorescence intensity between WT Naïve and IL-10 KO Naïve tissues. IL-10 KO+CCI un-injected mice exhibit heightened ipsilateral GFAP fluorescence intensity compared to IL-10 KO Naïves and are not significantly different than CCI+Saline or CCI+ DM/Saline conditions. Bilaterally, GFAP immunoreactive fluorescence intensity levels are greater in IL-10 KO+CCI+DM/pDNA-Ctrl mice and CCI+Saline/pDNA-IL-10 mice compared to IL-10 KO Naïve mice, but do not differ significantly from each other. Pain relieved IL-10 gene therapy treated mice (IL-10 KO+CCI+DM/pDNA-IL-10) reveal significantly less GFAP fluorescence intensity compared to allodynic gene therapy controls (IL-10 KO+CCI mice treated with either DM/pDNA-Ctrl or Saline/pDNA-IL-10), and are not significantly greater than IL-10 KO Naïves. Bar graphs represent mean ± SEM. Superimposed outlines in images (C–J) demarcate the unique dorsal horn regions of interest for each slice. For immunohistochemical analyses, N = 3–4 mice per group, as indicated. Post-hoc multiple comparisons via Fisher’s LSD (α = 0.05; *P < 0.05; **P < 0.01; ***P < 0.001).

