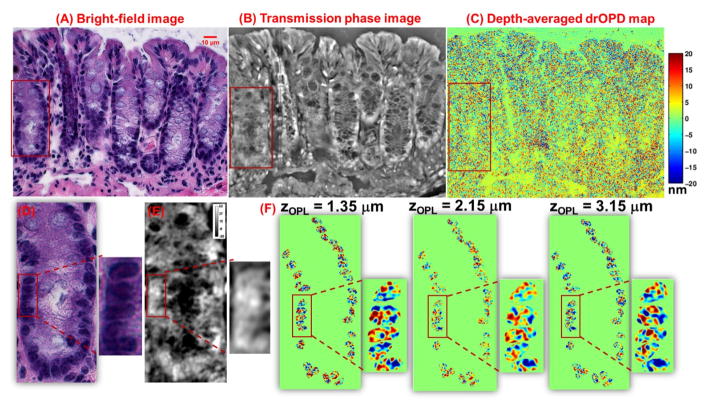
Figure 13.
Nuclear architecture maps obtained from the three imaging modalities of our optical microscopy system: (A) Bright-field image of an H&E-stained colon tissue, corresponding (B) transmission quantitative phase image and (C) depth-averaged (over the range of range of 1.35 to 3.15μm at a step size of 0.045μm) drOPD maps from an unstained colon tissue section. (D–F) The zoom-in regions of the red boxes in (A–C). (F) The drOPD map at 3 optical depths (central localization zOPL = 1.35μm, 2.25 μm and 3.15μm) from the unstained colon tissue. The scale bar shows drOPD value in nanometers.

