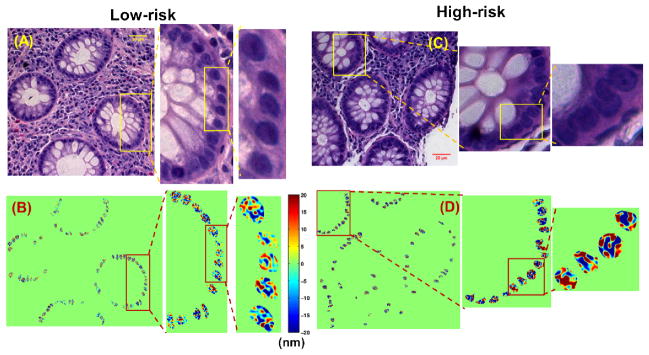
Figure 14.
Cancer risk assessment of UC patients: Bright-field image of stained H&E tissue section (from the initial tissue biopsy) from a (A) low-risk UC patient, and (C) a high-risk UC patient. drOPD maps for the same (B) low-risk and (D) high-risk UC patients computed from the same tissue sections as those used for bright-field imaging before staining.

