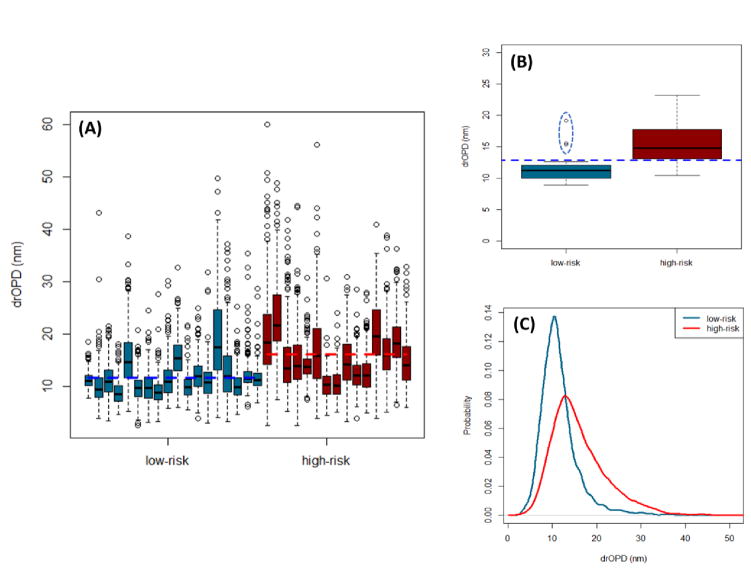
Figure 15.
nanoNAM based assessment and quantification of low- and high-risk UC patients. (a) Box plot of cell-level mean drOPD values for each patient. (b) Box plot of patient-level drOPD value for each patient. (c) Probability distribution of cell-level mean drOPD values from all patients in the low-risk and high-risk groups.

