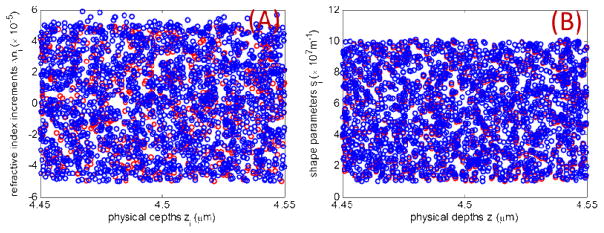
Figure 4.
Two sets (red and blue) of refractive index model parameters (A) Δni, and (B) si for modeling their joint effect on refractive index heterogeneity are shown. The two sets for both parameters are plotted as a function of the depth at which they alter the refractive index profile generated using Eq. (7). The heterogeneity is modeled around the physical depth of 4.5 μm.

