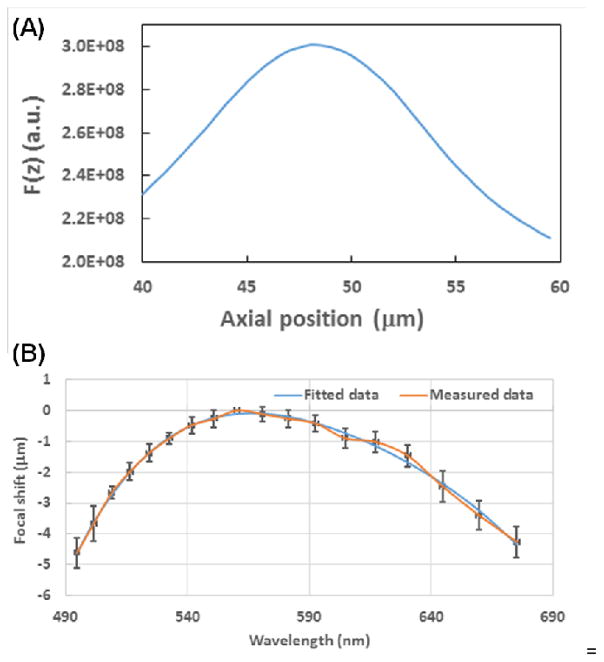
Figure 7.
(A) Squared gradient plot versus the axial position of the objective lens at the wavelength of 550 nm. (B) The dependence of the focal-plane shift on the wavelength. Each point was the average value from 20 measurements (orange line), and the error bar indicates standard deviation. Data was then fitted to a fourth-order polynomial (blue line).

