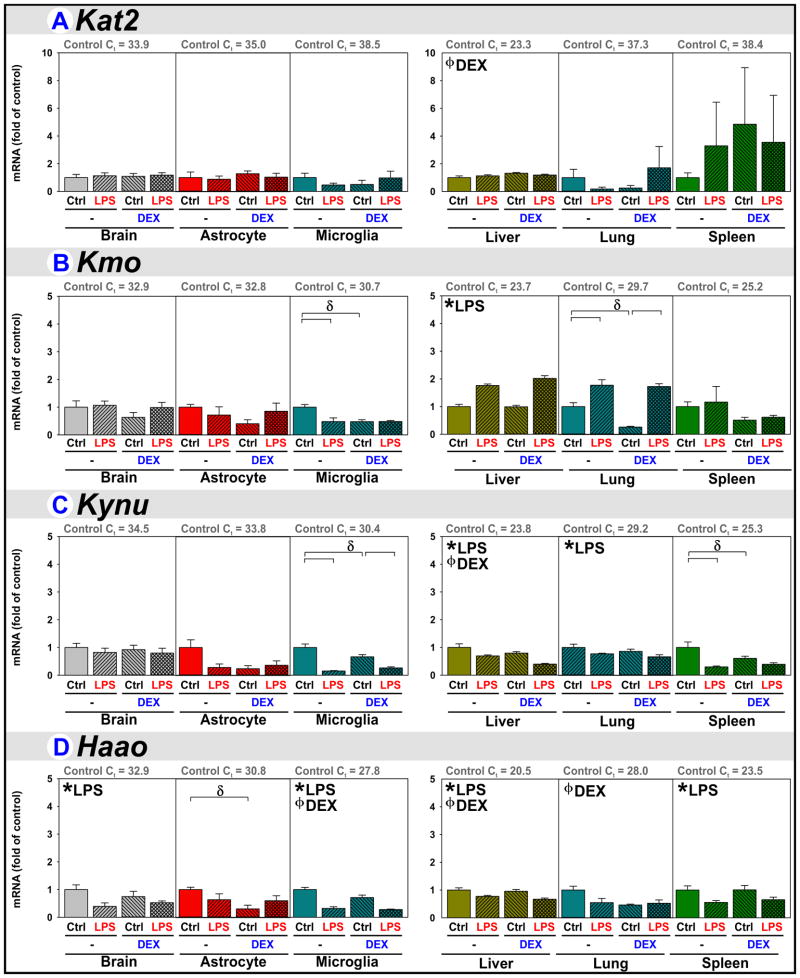
Figure 6. Downstream Kyn Pathway enzyme regulation by LPS and DEX.
Brain, astrocytes, microglia, liver, lung and spleen were obtained from mice 5 h after treatment with saline (Control), LPS, DEX or LPS+DEX to assess the relative changes in the mRNA expression of (A) Kat2, (B) Kmo, (C) Kynu and (D) Haao. * p ≤ 0.05 main effect of LPS. ϕ p ≤ 0.05 main effect of DEX. δ p ≤ 0.05 post hoc mean separation in the presence of a significant LPS x DEX interaction.

