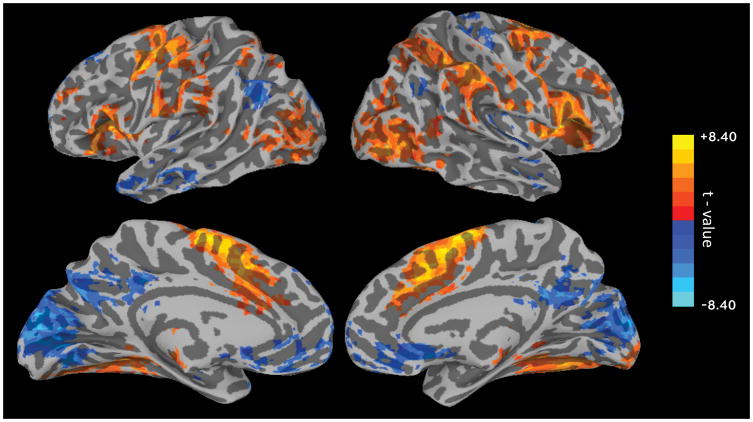
Figure 7. Variance Time Course Results.
BOLD signal correlation with the reaction time variability time course. Positive (yellow) values show regions where BOLD activity increased as reaction time variability increased; negative (blue) values show regions where BOLD activity decreased as reaction time variability increased. The map shows T-statistics after correction for multiple comparisons (corrected p < 0.05; nominal p < 0.01, cluster size > 81 voxels).

