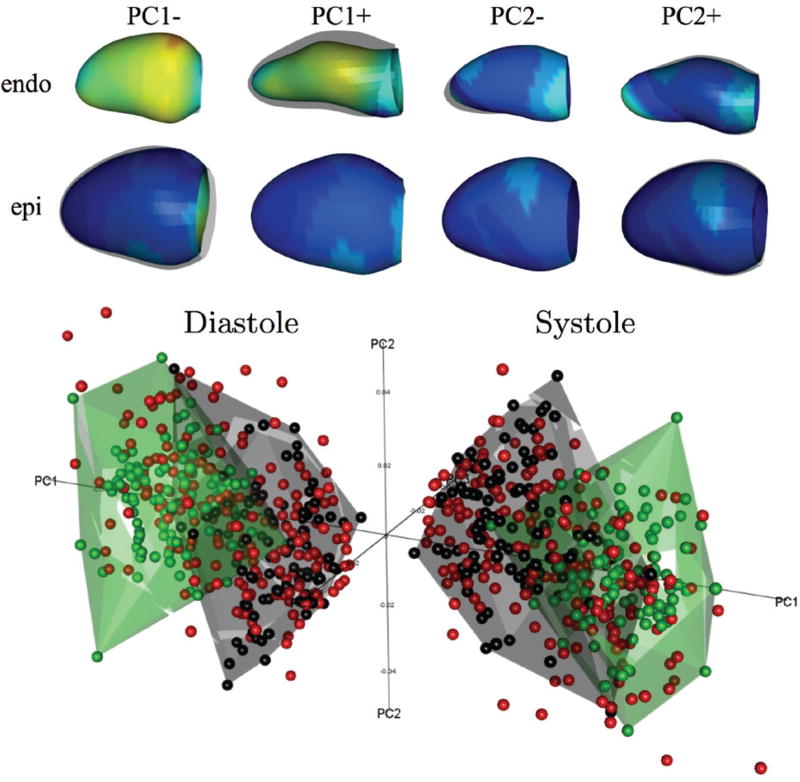
Fig. 2.
PCA results from the GMPT method. Top: 3D shapes corresponding to PC1 and PC2 modes, coloured according to the distance with respect to the average mean shape (blue: minimum; red: maximum). Bottom: Shapes in the PC1–PC3 space in ED (left) and ES (right); green=AV from training, black=MI from training, red=validation set.

