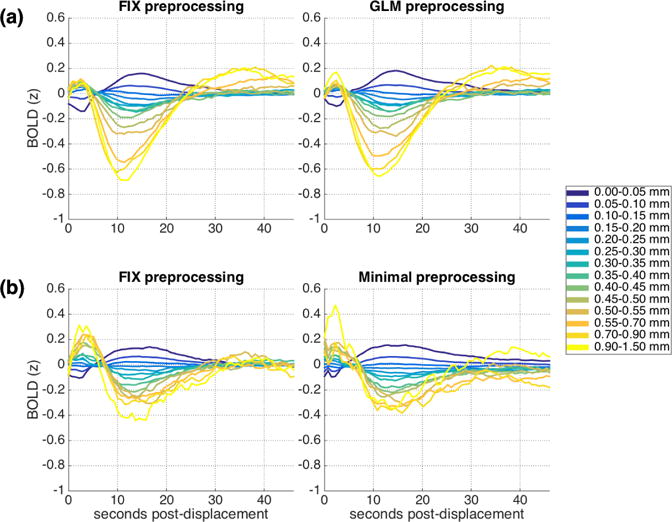
Figure 1.

Mean cortical BOLD signal following framewise displacements of similar magnitudes. (a) IU dataset, FIX (left) and GLM (right) preprocessing. (b) HCP dataset, FIX (left) and Minimal (right) preprocessing. The BOLD signal for each run was z-scored before dividing into epochs, combining across runs and across subjects, and averaging. See also Supplemental Figure 3 for a version of Fig. 1a (right) conducted using slice time correction, and Supplemental Figure 4 for a version of Fig 1b (left) conducted in the WM and CSF.
