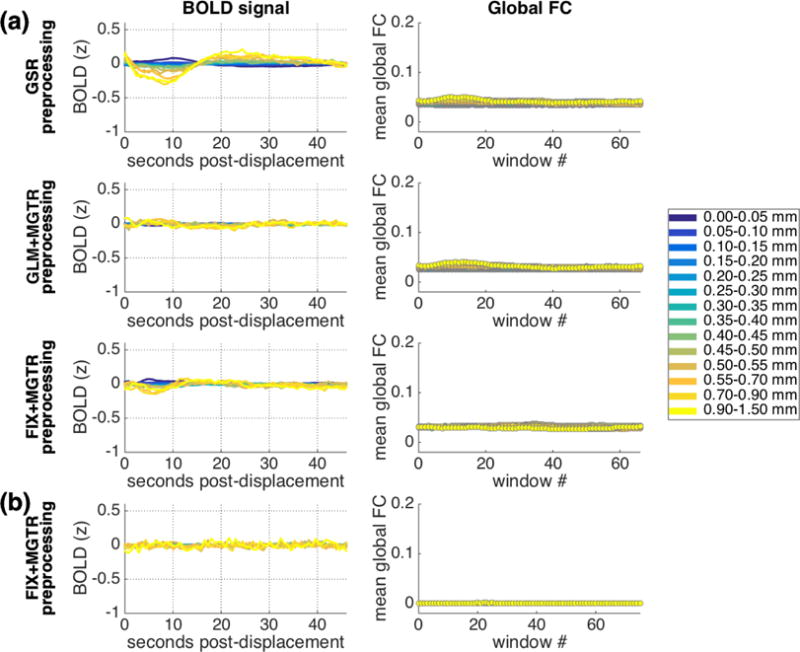
Figure 13.

Results when a global signal is removed in preprocessing, either by including the mean whole-brain signal in nuisance regression (IU data: a, top row) or by regressing out the mean cortical BOLD signal in a second step following conventional GLM preprocessing (IU data: a, second row) and following FIX preprocessing (IU data: a, third row; HCP data: b). Column 1: Main pattern of lagged BOLD structure following framewise displacements. Column 2: Mean global functional connectivity taken across sliding windows associated with displacements in each range, after strict censoring. Window 0 spans the ~20s immediately prior to a given displacement, and each window slides forward in time in 1 TR increments. Differences in global functional connectivity baselines across rows are likely to arise due to differences in preprocessing methods (e.g., differences in ROI coarseness). Y-axis ranges for both columns were selected to be as comparable as possible to original analyses (Figure 1; Figure 8).
