
Figure 4.
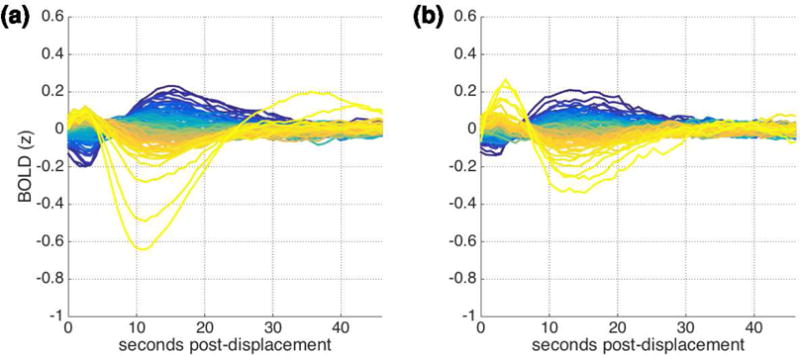
Mean cortical BOLD signal following data-derived displacement ranges, each corresponding to 1 percentile of displacements for (a) IU and (b) HCP datasets. Displacement ranges for each dataset are presented in Supplemental Figure 6; the smallest displacements are in blue while the largest displacements are in yellow.