
Figure 5.
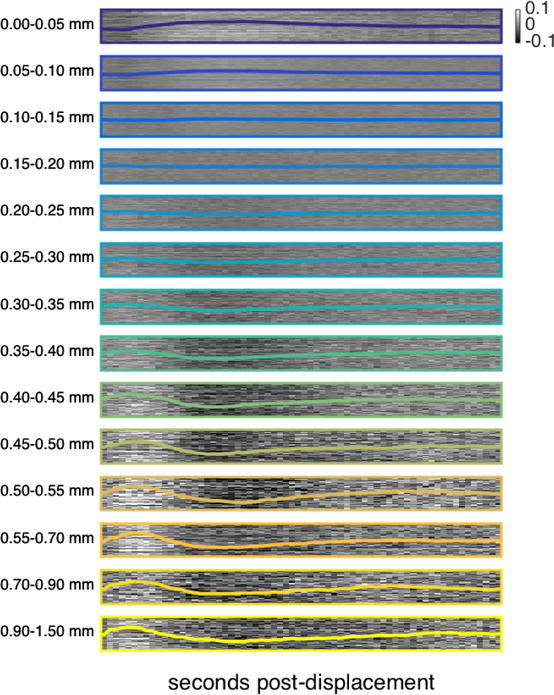
Main analysis performed at individual grayordinates for HCP data with FIX preprocessing. Each raster contains 15,000 rows; each row corresponds to one randomly-selected grayordinate and depicts the mean BOLD signal following similar framewise displacements at that grayordinate, from 0 to 46 seconds post-displacement. Each of the 14 rasters depicts the same 15,000 randomly selected cortical grayordinates in the same order. The mean cortical BOLD signal for each displacement range (previously presented in Fig. 1b, left) is superimposed in color. See also Supplemental Figure 7 for this same analysis repeated in white matter and CSF voxels.