
Figure 7.
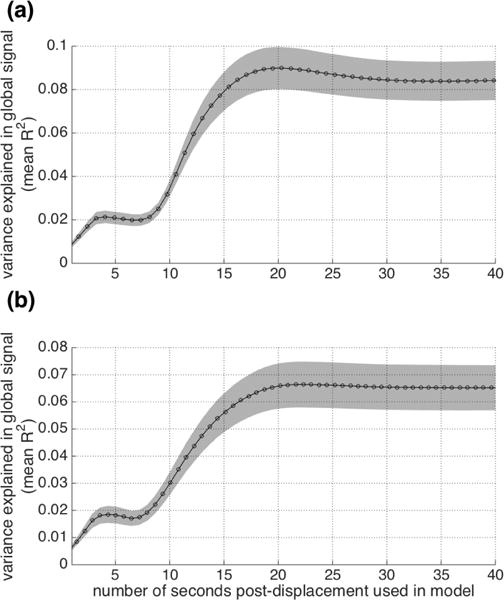
Predicting the global cortical BOLD signal as a function of customized models constructed from individual FD traces. Models vary in the length of time they include post-displacement (x axis). The y axis depicts the mean R2 across all scans along with 95% confidence intervals of the mean (for visualization), for (a) IU and (b) HCP datasets with FIX preprocessing.