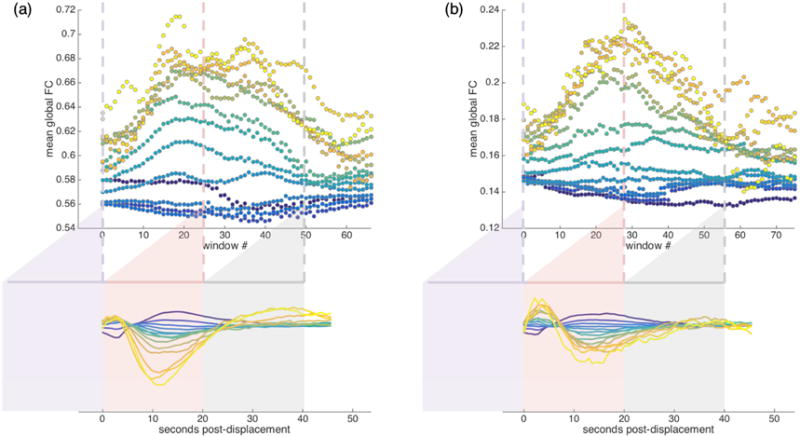
Figure 8.

Mean global functional connectivity taken across sliding windows associated with displacements in a given range for (a) IU and (b) HCP datasets with FIX preprocessing. Sliding windows are approximately 20 seconds long; window 0 (purple) spans the ~20s immediately prior to displacements in a given range; each subsequent window advances forward in time by 1 TR. Global FC is the mean of the FC matrix for a sliding window. Strict censoring at FD >= 0.2mm was conducted before all FC estimates were computed. For each displacement range, all such peri-displacement-event global FC window sequences were averaged first within subjects and then across subjects. Three example windows are shown to illustrate how the FC is sampled from the BOLD data. Note that the number of ROIs differs between datasets: a relatively coarse parcellation of 96 ROIs for IU data (a) and more fine-grained parcellation of 360 ROIs for HCP data (b), and this is likely to contribute to differences in global functional connectivity baselines across the datasets. See Figure 9 for example mean functional connectivity matrices that correspond to the points plotted in Figure 8a.
