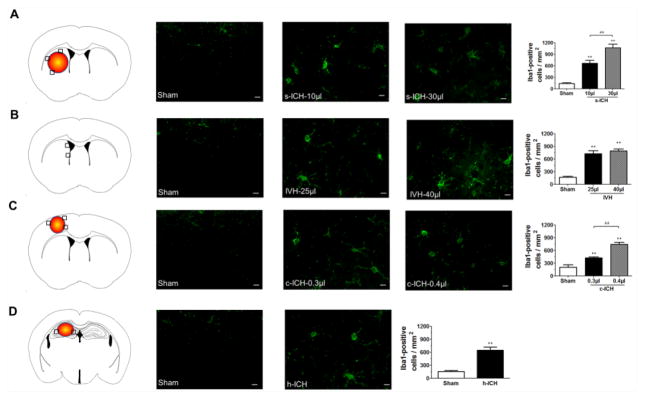
Fig. 5.
Microglia/macrophage activation at 72 h post-ICH. (A–D) The black boxes in the schematic diagrams indicate the preselected regions of striatum, lateral ventricles, cortex, and hippocampus used for counting Iba1-positive cells. Compared with that in sham groups, we observed more Iba1-positive activated microglia/macrophages around the injury sites in the striatum of the s-ICH mice (10 μl and 30 μl, A), in the brain regions around the lateral ventricles in the IVH mice (25 μl and 40 μl, B), around cortex of the c-ICH mice (0.3 μl and 0.4 μl collagenase groups, C), and around the hippocampus of the h-ICH mice (D). Quantification analysis confirmed that the number of Iba1-positive activated microglia/macrophages was significantly higher in mice that underwent the ICH models than in sham mice, and was significantly higher in the brains of mice in the 30-μl s-ICH and high-dose c-ICH groups than those of the 10-μl s-ICH and low-dose c-ICH groups, respectively. Scale bar = 10 μm. All data are presented as mean ± SD; n=6 mice/group; **P < 0.01 vs. Sham group; ##P < 0.01 vs. 10-μl s-ICH group or low-dose c-ICH group.

