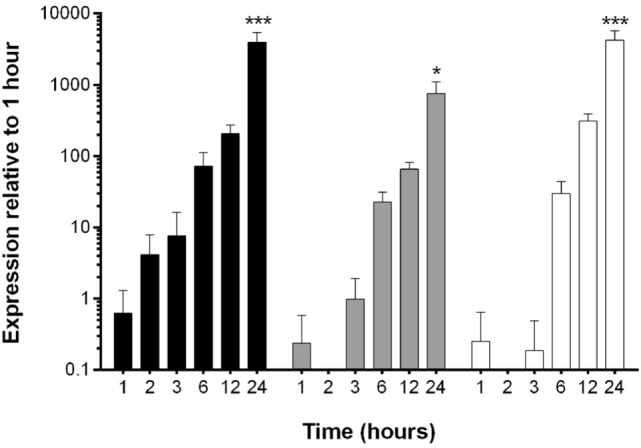
Figure 3.

Kinetic analysis of equine herpesvirus type 1 gene expression during lytic infection of primary equine fetal kidney cells (EFKCs). Expression of the IE gene was detected in EFKCs starting at 1 hpi (black bars), whereas expression of UL5 (gray bars) and gB (white bars) genes was not consistently detected until 3 and 6 hpi, respectively. Data are shown as mean plus SD. Statistical significance is indicated by asterisks and denotes an increase at 24 hpi compared to all earlier time points (*p < 0.05, ***p < 0.0001).
