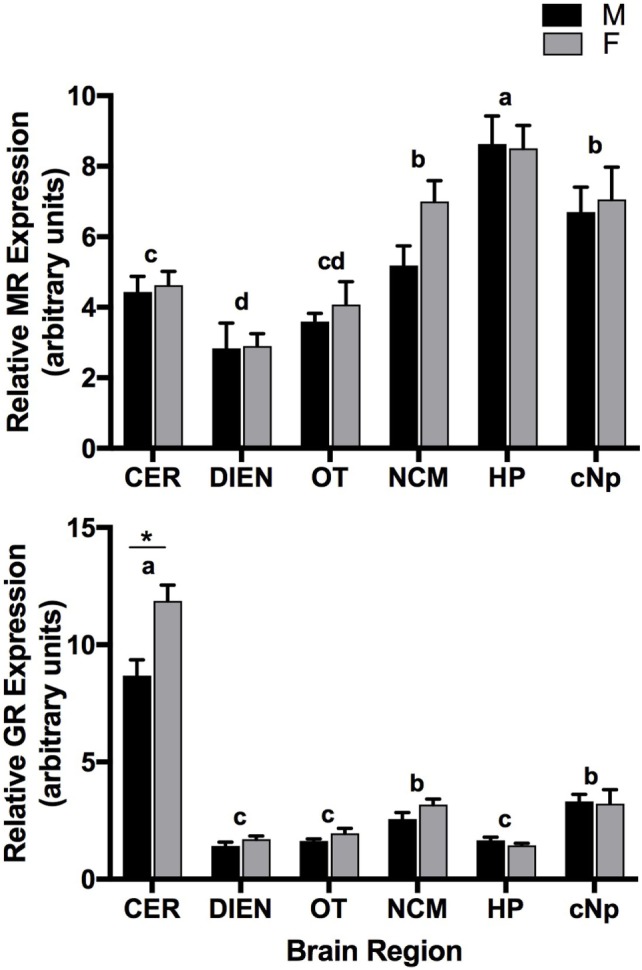
Figure 2.

Quantitative PCR results showing mineralocorticoid receptor (MR) (top panel) and glucocorticoid receptor (GR) (bottom panel) expression patterns (relative to glyceraldehyde-3-phosphate dehydrogenase) across six brain regions in adult male (M) and female (F) zebra finches. Letters above bars represent significant differences. *Indicates a significant difference between males and females in CER. Bars are means ± 1 SE. Sample sizes are as follows (n = MR/GR): CER, cerebellum (17/16); DIEN, diencephalon (17/16); OT, optic tectum (17/17); NCM, caudomedial nidopallium (16/16); HP, hippocampus (17/17); cNp, caudal nidopallium (13/13).
