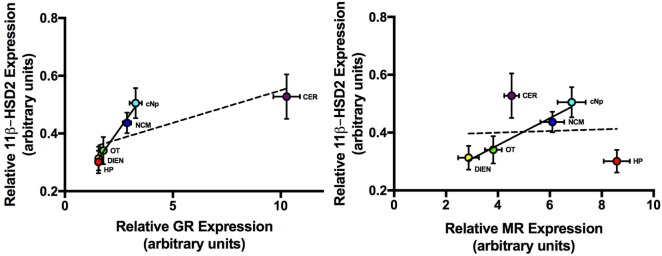
Figure 5.
The relationship between average (±1 SE) 11 beta-hydroxysteroid dehydrogenase type 2 (11β-HSD2) and GR (left panel) and average 11β-HSD2 and MR (right panel) expression levels across six brain regions. Dashed line = best fit line with all six brain regions included. Solid line = best fit line when CER and HP were excluded from the analysis. Abbreviations: CER, cerebellum; DIEN, diencephalon; OT, optic tectum; NCM, caudomedial nidopallium; HP, hippocampus; cNp, caudal nidopallium; MR, mineralocorticoid receptor; GR, glucocorticoid receptor.

