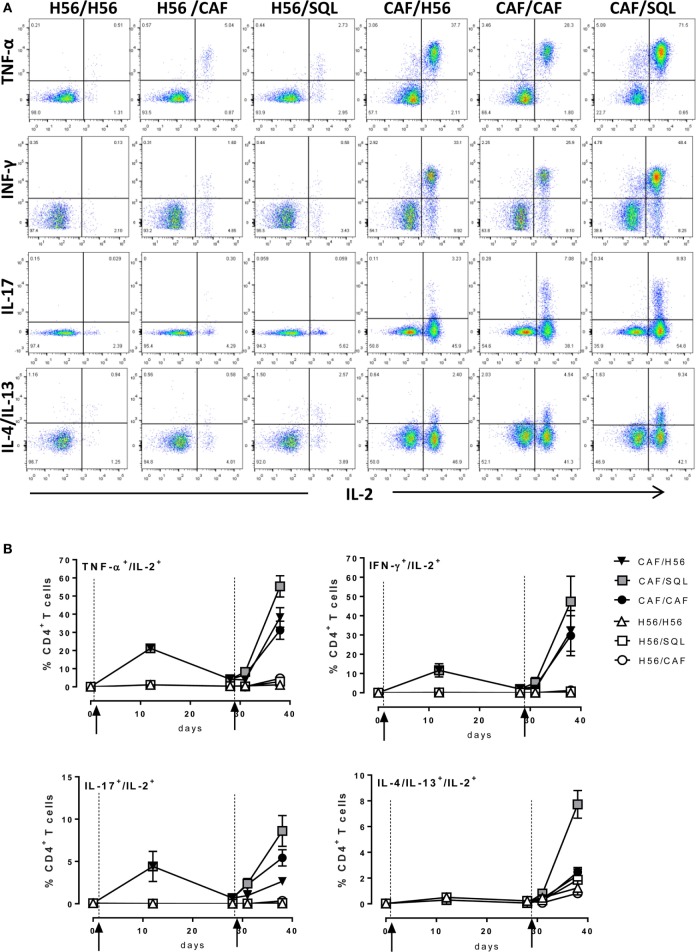
Figure 3.
Intracellular cytokines production. C57BL/6 mice were subcutaneously immunized as summarized in Figure 1. Spleens were collected 7 and 28 days after priming, and 3 and 10 days after boosting. Splenocytes were restimulated for 6 h with H56 protein. (A) Dot plots showing the production of TNF-α, IFN-γ, IL-17, IL-4/IL-13 versus IL-2 assessed on live CD4+ CD44+ lymphocytes in each group, collected 10 days after boosting. (B) Percentages of T cells positive for both IL-2 and the indicated cytokines, with respect to total CD4+ CD44+ cells, elicited by different vaccine formulations reported as mean ± SEM of five mice per group. Mann–Whitney test for multiple pairwise comparisons was used for assessing statistical difference between groups receiving the same booster and primed with H56 alone or H56 + CAF01 adjuvant. Kruskal–Wallis test, followed by Dunn’s post test for multiple comparison, was used to assess statistical difference among all groups (P ≤ 0.05).

