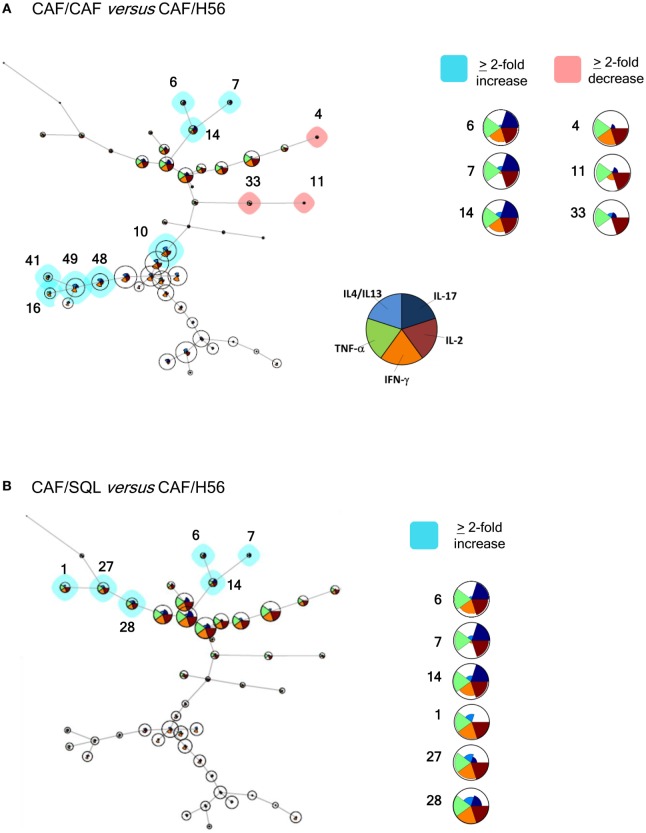
Figure 4.
Computational analysis of polyfunctional profiles of T cells. C57BL/6 mice were subcutaneously immunized as summarized in Figure 1. CD4+ and CD44+ cells from restimulated splenocytes were manually gated with FlowJov10, concatenated within the same immunization group, randomly downsampled to 15,000 cells and exported as uncompensated cells. Data were then compensated, logically transformed, and scaled with FlowSOM. A minimal spanning tree was obtained from the flowSet including FCS files of the groups primed with H56 + CAF01 and boosted with H56, H56 + CAF01, and H56 + o/w squalene. Size of the nodes is relative to the percentage of cells present in each cluster. Each node is represented by a star chart indicating the relative mean fluorescence intensity values of each cytokine; the height of each sector indicates the intensity, if the part reaches the border of the circle, the cells have maximal expression for that cytokine. A relative increase (blue nodes) or decrease (pink nodes) of at least twofold of the cell percentage in nodes of the CAF/CAF (A) or CAF/SQL (B) groups compared with the CAF/H56 group is shown. A magnification or colored nodes, indicated by numbers, is reported on the right.

