
FIGURE 2.
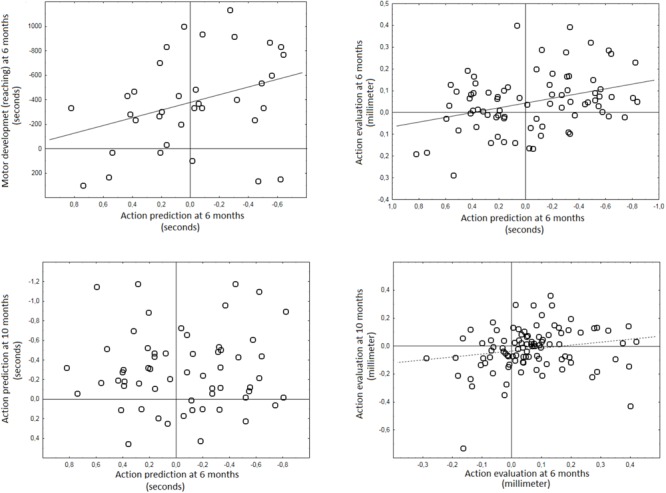
Correlations between key variables used to assess the presence of internal models in early infancy. All variables (Action prediction = latency in seconds, negative values = prediction; action evaluation = relative pupil dilation in mm positive values = surprise to inappropriate social interactions; motor performance = latency in seconds, negative values = prediction) maintain original format (variables are not flipped) as reported in prior work. Solid diagonal lines represent significant correlations (p < 0.05) whereas dashed line represent marginally significant interaction (p = 0.06). Horizontal and vertical lines mark zero-point (division between prediction and reaction for action prediction and motor development and between larger pupil to inappropriate or appropriate events for action evaluation).